
Page 113 - Managing Global Warming
P. 113
Electricity generation in the world of nuclear power industry 83
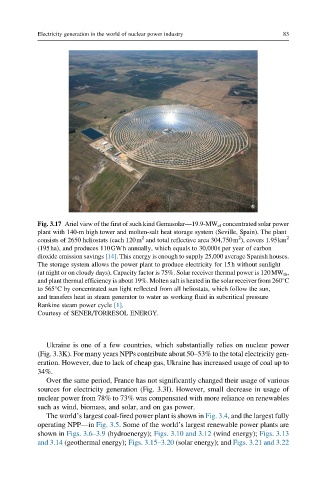
Fig. 3.17 Ariel view of the first of such kind Gemasolar—19.9-MW el concentrated solar power
plant with 140-m high tower and molten-salt heat storage system (Seville, Spain). The plant
2
2
consists of 2650 heliostats (each 120m and total reflective area 304,750m ), covers 1.95km 2
(195ha), and produces 110GWh annually, which equals to 30,000t per year of carbon
dioxide emission savings [14]. This energy is enough to supply 25,000 average Spanish houses.
The storage system allows the power plant to produce electricity for 15h without sunlight
(at night or on cloudy days). Capacity factor is 75%. Solar receiver thermal power is 120MW th ,
and plant thermal efficiency is about 19%. Molten salt is heated in the solar receiver from 260°C
to 565°C by concentrated sun light reflected from all heliostats, which follow the sun,
and transfers heat in steam generator to water as working fluid in subcritical pressure
Rankine steam power cycle [1].
Courtesy of SENER/TORRESOL ENERGY.
Ukraine is one of a few countries, which substantially relies on nuclear power
(Fig. 3.3K). For many years NPPs contribute about 50–53% to the total electricity gen-
eration. However, due to lack of cheap gas, Ukraine has increased usage of coal up to
34%.
Over the same period, France has not significantly changed their usage of various
sources for electricity generation (Fig. 3.3I). However, small decrease in usage of
nuclear power from 78% to 73% was compensated with more reliance on renewables
such as wind, biomass, and solar, and on gas power.
The world’s largest coal-fired power plant is shown in Fig. 3.4, and the largest fully
operating NPP—in Fig. 3.5. Some of the world’s largest renewable power plants are
shown in Figs. 3.6–3.9 (hydroenergy); Figs. 3.10 and 3.12 (wind energy); Figs. 3.13
and 3.14 (geothermal energy); Figs. 3.15–3.20 (solar energy); and Figs. 3.21 and 3.22