
Page 117 - Managing Global Warming
P. 117
Electricity generation in the world of nuclear power industry 87
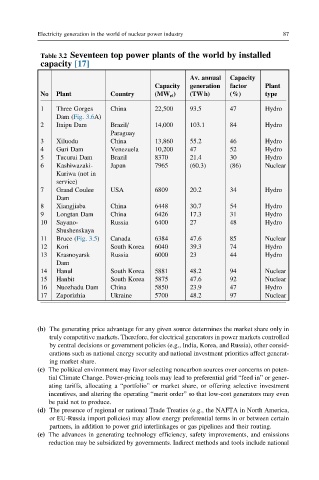
Table 3.2 Seventeen top power plants of the world by installed
capacity [17]
Av. annual Capacity
Capacity generation factor Plant
No Plant Country (MW el ) (TWh) (%) type
1 Three Gorges China 22,500 93.5 47 Hydro
Dam (Fig. 3.6A)
2 Itaipu Dam Brazil/ 14,000 103.1 84 Hydro
Paraguay
3 Xiluodu China 13,860 55.2 46 Hydro
4 Guri Dam Venezuela 10,200 47 52 Hydro
5 Tucurui Dam Brazil 8370 21.4 30 Hydro
6 Kashiwazaki- Japan 7965 (60.3) (86) Nuclear
Kariwa (not in
service)
7 Grand Coulee USA 6809 20.2 34 Hydro
Dam
8 Xiangjiaba China 6448 30.7 54 Hydro
9 Longtan Dam China 6426 17.3 31 Hydro
10 Sayano- Russia 6400 27 48 Hydro
Shushenskaya
11 Bruce (Fig. 3.5) Canada 6384 47.6 85 Nuclear
12 Kori South Korea 6040 39.3 74 Hydro
13 Krasnoyarsk Russia 6000 23 44 Hydro
Dam
14 Hanul South Korea 5881 48.2 94 Nuclear
15 Hanbit South Korea 5875 47.6 92 Nuclear
16 Nuozhadu Dam China 5850 23.9 47 Hydro
17 Zaporizhia Ukraine 5700 48.2 97 Nuclear
(b) The generating price advantage for any given source determines the market share only in
truly competitive markets. Therefore, for electrical generators in power markets controlled
by central decisions or government policies (e.g., India, Korea, and Russia), other consid-
erations such as national energy security and national investment priorities affect generat-
ing market share.
(c) The political environment may favor selecting noncarbon sources over concerns on poten-
tial Climate Change. Power-pricing tools may lead to preferential grid “feed in” or gener-
ating tariffs, allocating a “portfolio” or market share, or offering selective investment
incentives, and altering the operating “merit order” so that low-cost generators may even
be paid not to produce.
(d) The presence of regional or national Trade Treaties (e.g., the NAFTA in North America,
or EU-Russia import policies) may allow energy preferential terms in or between certain
partners, in addition to power grid interlinkages or gas pipelines and their routing.
(e) The advances in generating technology efficiency, safety improvements, and emissions
reduction may be subsidized by governments. Indirect methods and tools include national