
Page 119 - Managing Global Warming
P. 119
Electricity generation in the world of nuclear power industry 89
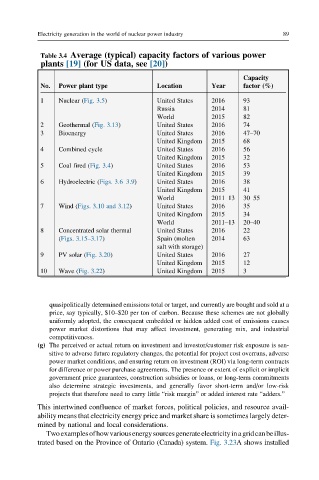
Table 3.4 Average (typical) capacity factors of various power
plants [19] (for US data, see [20])
Capacity
No. Power plant type Location Year factor (%)
1 Nuclear (Fig. 3.5) United States 2016 93
Russia 2014 81
World 2015 82
2 Geothermal (Fig. 3.13) United States 2016 74
3 Bioenergy United States 2016 47–70
United Kingdom 2015 68
4 Combined cycle United States 2016 56
United Kingdom 2015 32
5 Coal fired (Fig. 3.4) United States 2016 53
United Kingdom 2015 39
6 Hydroelectric (Figs. 3.6–3.9) United States 2016 38
United Kingdom 2015 41
World 2011–13 30–55
7 Wind (Figs. 3.10 and 3.12) United States 2016 35
United Kingdom 2015 34
World 2011–13 20–40
8 Concentrated solar thermal United States 2016 22
(Figs. 3.15–3.17) Spain (molten 2014 63
salt with storage)
9 PV solar (Fig. 3.20) United States 2016 27
United Kingdom 2015 12
10 Wave (Fig. 3.22) United Kingdom 2015 3
quasipolitically determined emissions total or target, and currently are bought and sold at a
price, say typically, $10–$20 per ton of carbon. Because these schemes are not globally
uniformly adopted, the consequent embedded or hidden added cost of emissions causes
power market distortions that may affect investment, generating mix, and industrial
competitiveness.
(g) The perceived or actual return on investment and investor/customer risk exposure is sen-
sitive to adverse future regulatory changes, the potential for project cost overruns, adverse
power market conditions, and ensuring return on investment (ROI) via long-term contracts
for difference or power purchase agreements. The presence or extent of explicit or implicit
government price guarantees, construction subsidies or loans, or long-term commitments
also determine strategic investments, and generally favor short-term and/or low-risk
projects that therefore need to carry little “risk margin” or added interest rate “adders.”
This intertwined confluence of market forces, political policies, and resource avail-
ability means that electricity energy price and market share is sometimes largely deter-
mined by national and local considerations.
Twoexamplesofhowvariousenergysourcesgenerateelectricityinagridcanbeillus-
trated based on the Province of Ontario (Canada) system. Fig. 3.23A shows installed