
Page 120 - Managing Global Warming
P. 120
90 Managing Global Warming
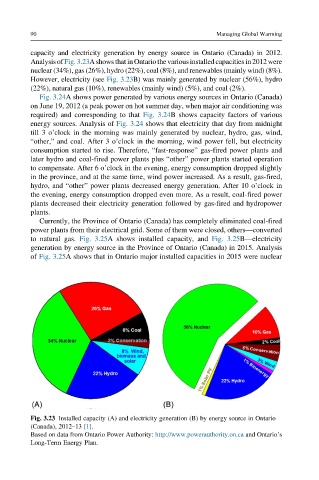
capacity and electricity generation by energy source in Ontario (Canada) in 2012.
Analysis ofFig. 3.23A shows thatinOntariothe variousinstalled capacitiesin2012were
nuclear (34%), gas (26%), hydro (22%), coal (8%), and renewables (mainly wind) (8%).
However, electricity (see Fig. 3.23B) was mainly generated by nuclear (56%), hydro
(22%), natural gas (10%), renewables (mainly wind) (5%), and coal (2%).
Fig. 3.24A shows power generated by various energy sources in Ontario (Canada)
on June 19, 2012 (a peak power on hot summer day, when major air conditioning was
required) and corresponding to that Fig. 3.24B shows capacity factors of various
energy sources. Analysis of Fig. 3.24 shows that electricity that day from midnight
till 3 o’clock in the morning was mainly generated by nuclear, hydro, gas, wind,
“other,” and coal. After 3 o’clock in the morning, wind power fell, but electricity
consumption started to rise. Therefore, “fast-response” gas-fired power plants and
later hydro and coal-fired power plants plus “other” power plants started operation
to compensate. After 6 o’clock in the evening, energy consumption dropped slightly
in the province, and at the same time, wind power increased. As a result, gas-fired,
hydro, and “other” power plants decreased energy generation. After 10 o’clock in
the evening, energy consumption dropped even more. As a result, coal-fired power
plants decreased their electricity generation followed by gas-fired and hydropower
plants.
Currently, the Province of Ontario (Canada) has completely eliminated coal-fired
power plants from their electrical grid. Some of them were closed, others—converted
to natural gas. Fig. 3.25A shows installed capacity, and Fig. 3.25B—electricity
generation by energy source in the Province of Ontario (Canada) in 2015. Analysis
of Fig. 3.25A shows that in Ontario major installed capacities in 2015 were nuclear
Fig. 3.23 Installed capacity (A) and electricity generation (B) by energy source in Ontario
(Canada), 2012–13 [1].
Based on data from Ontario Power Authority: http://www.powerauthority.on.ca and Ontario’s
Long-Term Energy Plan.