
Page 123 - Managing Global Warming
P. 123
Electricity generation in the world of nuclear power industry 93
also dependent on the capacity factor. The higher the capacity factor—the better, as
generating costs fall proportionally. However, some renewable energy sources with
exception of large hydroelectric power plants can have significantly lower capacity
factors compared to those of thermal and nuclear power plants. Consequently, in
today’s politico-socio-economic world, many governments subsidize selected low-
capacity factor sources, like wind and solar, using preferential rates, enforced portfo-
lios, artificial tariffs, market rules, and power purchase agreements to partly offset the
competitive advantage of lower cost generation from natural gas, coal, and nuclear. It
is against the market background, of low cost natural gas and of directly or indirectly
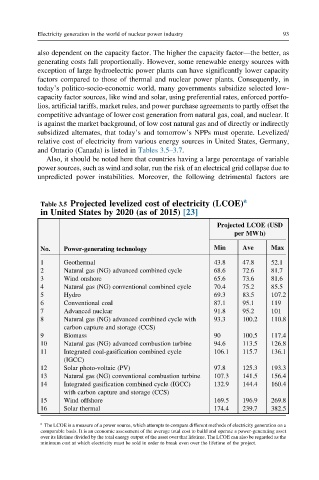
subsidized alternates, that today’s and tomorrow’s NPPs must operate. Levelized/
relative cost of electricity from various energy sources in United States, Germany,
and Ontario (Canada) is listed in Tables 3.5–3.7.
Also, it should be noted here that countries having a large percentage of variable
power sources, such as wind and solar, run the risk of an electrical grid collapse due to
unpredicted power instabilities. Moreover, the following detrimental factors are
a
Table 3.5 Projected levelized cost of electricity (LCOE)
in United States by 2020 (as of 2015) [23]
Projected LCOE (USD
per MWh)
Min Ave Max
No. Power-generating technology
1 Geothermal 43.8 47.8 52.1
2 Natural gas (NG) advanced combined cycle 68.6 72.6 81.7
3 Wind onshore 65.6 73.6 81.6
4 Natural gas (NG) conventional combined cycle 70.4 75.2 85.5
5 Hydro 69.3 83.5 107.2
6 Conventional coal 87.1 95.1 119
7 Advanced nuclear 91.8 95.2 101
8 Natural gas (NG) advanced combined cycle with 93.3 100.2 110.8
carbon capture and storage (CCS)
9 Biomass 90 100.5 117.4
10 Natural gas (NG) advanced combustion turbine 94.6 113.5 126.8
11 Integrated coal-gasification combined cycle 106.1 115.7 136.1
(IGCC)
12 Solar photo-voltaic (PV) 97.8 125.3 193.3
13 Natural gas (NG) conventional combustion turbine 107.3 141.5 156.4
14 Integrated gasification combined cycle (IGCC) 132.9 144.4 160.4
with carbon capture and storage (CCS)
15 Wind offshore 169.5 196.9 269.8
16 Solar thermal 174.4 239.7 382.5
a
The LCOE is a measure of a power source, which attempts to compare different methods of electricity generation on a
comparable basis. It is an economic assessment of the average total cost to build and operate a power-generating asset
over its lifetime divided by the total energy output of the asset over that lifetime. The LCOE can also be regarded as the
minimum cost at which electricity must be sold in order to break even over the lifetime of the project.