
Page 122 - Managing Global Warming
P. 122
92 Managing Global Warming
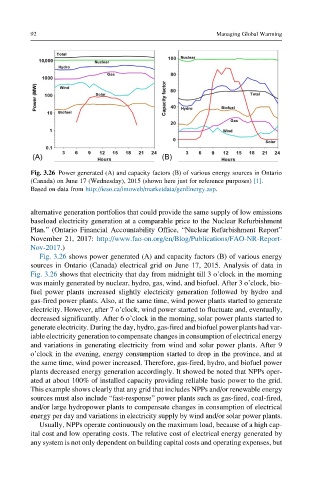
Fig. 3.26 Power generated (A) and capacity factors (B) of various energy sources in Ontario
(Canada) on June 17 (Wednesday), 2015 (shown here just for reference purposes) [1].
Based on data from http://ieso.ca/imoweb/marketdata/genEnergy.asp.
alternative generation portfolios that could provide the same supply of low emissions
baseload electricity generation at a comparable price to the Nuclear Refurbishment
Plan.” (Ontario Financial Accountability Office, “Nuclear Refurbishment Report”
November 21, 2017: http://www.fao-on.org/en/Blog/Publications/FAO-NR-Report-
Nov-2017.)
Fig. 3.26 shows power generated (A) and capacity factors (B) of various energy
sources in Ontario (Canada) electrical grid on June 17, 2015. Analysis of data in
Fig. 3.26 shows that electricity that day from midnight till 3 o’clock in the morning
was mainly generated by nuclear, hydro, gas, wind, and biofuel. After 3 o’clock, bio-
fuel power plants increased slightly electricity generation followed by hydro and
gas-fired power plants. Also, at the same time, wind power plants started to generate
electricity. However, after 7 o’clock, wind power started to fluctuate and, eventually,
decreased significantly. After 6 o’clock in the morning, solar power plants started to
generate electricity. During the day, hydro, gas-fired and biofuel power plants had var-
iable electricity generation to compensate changes in consumption of electrical energy
and variations in generating electricity from wind and solar power plants. After 9
o’clock in the evening, energy consumption started to drop in the province, and at
the same time, wind power increased. Therefore, gas-fired, hydro, and biofuel power
plants decreased energy generation accordingly. It showed be noted that NPPs oper-
ated at about 100% of installed capacity providing reliable basic power to the grid.
This example shows clearly that any grid that includes NPPs and/or renewable energy
sources must also include “fast-response” power plants such as gas-fired, coal-fired,
and/or large hydropower plants to compensate changes in consumption of electrical
energy per day and variations in electricity supply by wind and/or solar power plants.
Usually, NPPs operate continuously on the maximum load, because of a high cap-
ital cost and low operating costs. The relative cost of electrical energy generated by
any system is not only dependent on building capital costs and operating expenses, but