
Page 121 - Managing Global Warming
P. 121
Electricity generation in the world of nuclear power industry 91
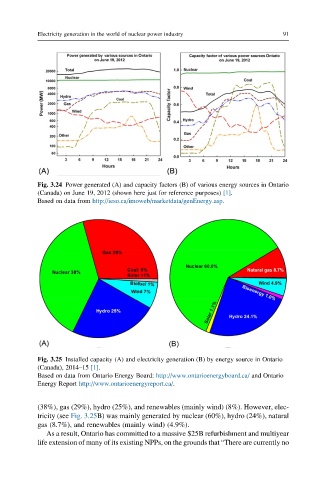
Fig. 3.24 Power generated (A) and capacity factors (B) of various energy sources in Ontario
(Canada) on June 19, 2012 (shown here just for reference purposes) [1].
Based on data from http://ieso.ca/imoweb/marketdata/genEnergy.asp.
Fig. 3.25 Installed capacity (A) and electricity generation (B) by energy source in Ontario
(Canada), 2014–15 [1].
Based on data from Ontario Energy Board: http://www.ontarioenergyboard.ca/ and Ontario
Energy Report http://www.ontarioenergyreport.ca/.
(38%), gas (29%), hydro (25%), and renewables (mainly wind) (8%). However, elec-
tricity (see Fig. 3.25B) was mainly generated by nuclear (60%), hydro (24%), natural
gas (8.7%), and renewables (mainly wind) (4.9%).
As a result, Ontario has committed to a massive $25B refurbishment and multiyear
life extension of many of its existing NPPs, on the grounds that “There are currently no