
Page 12 - Managing Global Warming
P. 12
6 Managing Global Warming
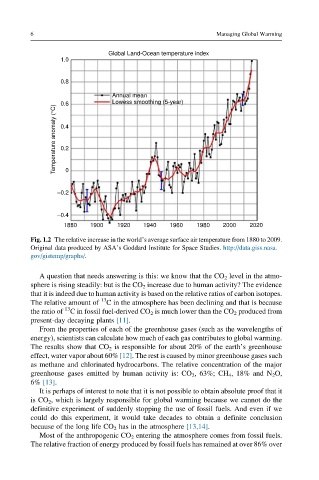
Global Land-Ocean temperature index
1.0
0.8
Annual mean
0.6 Lowess smoothing (5-year)
Temperature anomaly (°C) 0.4
0.2
–0.2 0
–0.4
1880 1900 1920 1940 1960 1980 2000 2020
Fig. 1.2 The relative increase in the world’s average surface air temperature from 1880 to 2009.
Original data produced by ASA’s Goddard Institute for Space Studies. http://data.giss.nasa.
gov/gistemp/graphs/.
A question that needs answering is this: we know that the CO 2 level in the atmo-
sphere is rising steadily: but is the CO 2 increase due to human activity? The evidence
that it is indeed due to human activity is based on the relative ratios of carbon isotopes.
The relative amount of 13 C in the atmosphere has been declining and that is because
13
the ratio of C in fossil fuel-derived CO 2 is much lower than the CO 2 produced from
present-day decaying plants [11].
From the properties of each of the greenhouse gases (such as the wavelengths of
energy), scientists can calculate how much of each gas contributes to global warming.
The results show that CO 2 is responsible for about 20% of the earth’s greenhouse
effect, water vapor about 60% [12]. The rest is caused by minor greenhouse gases such
as methane and chlorinated hydrocarbons. The relative concentration of the major
greenhouse gases emitted by human activity is: CO 2 , 63%; CH 4 , 18% and N 2 O,
6% [13].
It is perhaps of interest to note that it is not possible to obtain absolute proof that it
is CO 2 , which is largely responsible for global warming because we cannot do the
definitive experiment of suddenly stopping the use of fossil fuels. And even if we
could do this experiment, it would take decades to obtain a definite conclusion
because of the long life CO 2 has in the atmosphere [13,14].
Most of the anthropogenic CO 2 entering the atmosphere comes from fossil fuels.
The relative fraction of energy produced by fossil fuels has remained at over 86% over