
Page 13 - Managing Global Warming
P. 13
Why do we have global warming? 7
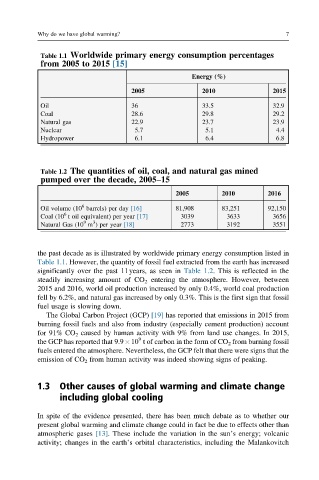
Table 1.1 Worldwide primary energy consumption percentages
from 2005 to 2015 [15]
Energy (%)
2005 2010 2015
Oil 36 33.5 32.9
Coal 28.6 29.8 29.2
Natural gas 22.9 23.7 23.9
Nuclear 5.7 5.1 4.4
Hydropower 6.1 6.4 6.8
Table 1.2 The quantities of oil, coal, and natural gas mined
pumped over the decade, 2005–15
2005 2010 2016
6
Oil volume (10 barrels) per day [16] 81,908 83,251 92,150
6
Coal (10 t oil equivalent) per year [17] 3039 3633 3656
3
9
Natural Gas (10 m ) per year [18] 2773 3192 3551
the past decade as is illustrated by worldwide primary energy consumption listed in
Table 1.1. However, the quantity of fossil fuel extracted from the earth has increased
significantly over the past 11years, as seen in Table 1.2. This is reflected in the
steadily increasing amount of CO 2 entering the atmosphere. However, between
2015 and 2016, world oil production increased by only 0.4%, world coal production
fell by 6.2%, and natural gas increased by only 0.3%. This is the first sign that fossil
fuel usage is slowing down.
The Global Carbon Project (GCP) [19] has reported that emissions in 2015 from
burning fossil fuels and also from industry (especially cement production) account
for 91% CO 2 caused by human activity with 9% from land use changes. In 2015,
9
the GCP has reported that 9.9 10 t of carbon in the form of CO 2 from burning fossil
fuels entered the atmosphere. Nevertheless, the GCP felt that there were signs that the
emission of CO 2 from human activity was indeed showing signs of peaking.
1.3 Other causes of global warming and climate change
including global cooling
In spite of the evidence presented, there has been much debate as to whether our
present global warming and climate change could in fact be due to effects other than
atmospheric gases [13]. These include the variation in the sun’s energy; volcanic
activity; changes in the earth’s orbital characteristics, including the Malankovitch