
Page 18 - Managing Global Warming
P. 18
12 Managing Global Warming
The population of the world is increasing and so is the need for more energy with a
9
greater demand for more electricity. The world population (it is now 7.6 10
9
according to the latest 2018 United Nation estimate) is expected to reach 9 10 in
2050. It is increasing at a rate of 1.09% per year at the moment (2018) down from
1.14% per year in 2016 and down from the peak in 1963 of 2.2% per year. The expected
rate of growth in energy demand over the next decade is greater than the growth rate of
the population; this is largely due to the increase demand for electricity in developing
countries. Electricity generation is expected to increase from 25 10 12 kWh in 2017 to
31.2 10 12 kWh in 2030—an increase of almost 2% per year [37].
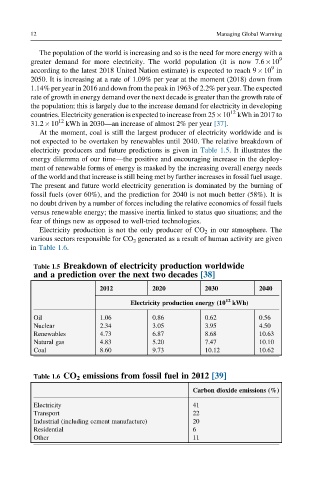
At the moment, coal is still the largest producer of electricity worldwide and is
not expected to be overtaken by renewables until 2040. The relative breakdown of
electricity producers and future predictions is given in Table 1.5. It illustrates the
energy dilemma of our time—the positive and encouraging increase in the deploy-
ment of renewable forms of energy is masked by the increasing overall energy needs
of the world and that increase is still being met by further increases in fossil fuel usage.
The present and future world electricity generation is dominated by the burning of
fossil fuels (over 60%), and the prediction for 2040 is not much better (58%). It is
no doubt driven by a number of forces including the relative economics of fossil fuels
versus renewable energy; the massive inertia linked to status quo situations; and the
fear of things new as opposed to well-tried technologies.
Electricity production is not the only producer of CO 2 in our atmosphere. The
various sectors responsible for CO 2 generated as a result of human activity are given
in Table 1.6.
Table 1.5 Breakdown of electricity production worldwide
and a prediction over the next two decades [38]
2012 2020 2030 2040
12
Electricity production energy (10 kWh)
Oil 1.06 0.86 0.62 0.56
Nuclear 2.34 3.05 3.95 4.50
Renewables 4.73 6.87 8.68 10.63
Natural gas 4.83 5.20 7.47 10.10
Coal 8.60 9.73 10.12 10.62
Table 1.6 CO 2 emissions from fossil fuel in 2012 [39]
Carbon dioxide emissions (%)
Electricity 41
Transport 22
Industrial (including cement manufacture) 20
Residential 6
Other 11