
Page 146 - Managing Global Warming
P. 146
110 Managing Global Warming
reactors, the number of BWRs/ABWRs and PHWRs will possibly decrease within
next 20–25years. Furthermore, within next 10–15years or so, all advanced gas-cooled
reactors (AGRs) and light-water-cooled graphite-moderated reactors (LGRs) will be
shut down. However, instead of carbon-dioxide-cooled AGRs helium-cooled reactors
will be built and put into operation.
Analysis of the data in Tables 3.12 and 3.13 shows that real nuclear “renaissance” is
in China (22 reactors built and put into operation within the past 6years!), in South
Korea (addition of 5 reactors), and in Russia (addition of 3 reactors). Meanwhile,
the most significant drop in a number of reactors is in Japan (12 reactors were shut
down) (only several reactors out of 42 are currently in operation), in Germany (9 reac-
tors), in United States (5 reactors), in United Kingdom (4 reactors), and in Canada
(3 reactors). In addition, Germany and Canada have no plans to build new reactors.
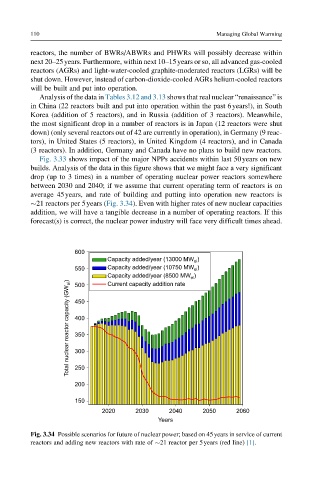
Fig. 3.33 shows impact of the major NPPs accidents within last 50years on new
builds. Analysis of the data in this figure shows that we might face a very significant
drop (up to 3 times) in a number of operating nuclear power reactors somewhere
between 2030 and 2040; if we assume that current operating term of reactors is on
average 45years, and rate of building and putting into operation new reactors is
21 reactors per 5years (Fig. 3.34). Even with higher rates of new nuclear capacities
addition, we will have a tangible decrease in a number of operating reactors. If this
forecast(s) is correct, the nuclear power industry will face very difficult times ahead.
600
Capacity added/year (13000 MW )
el
550 Capacity added/year (10750 MW )
el
Capacity added/year (8500 MW )
el
Total nuclear reactor capacity (GW el ) 400
Current capacity addition rate
500
450
350
300
250
200
150
2020 2030 2040 2050 2060
Years
Fig. 3.34 Possible scenarios for future of nuclear power; based on 45years in service of current
reactors and adding new reactors with rate of 21 reactor per 5years (red line) [1].