
Page 144 - Managing Global Warming
P. 144
108 Managing Global Warming
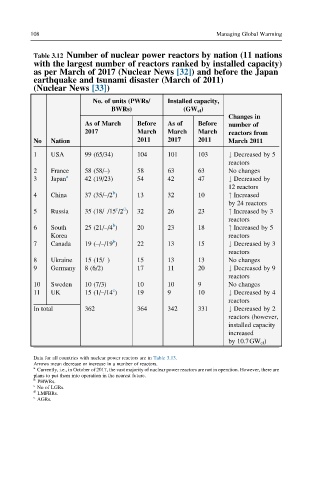
Table 3.12 Number of nuclear power reactors by nation (11 nations
with the largest number of reactors ranked by installed capacity)
as per March of 2017 (Nuclear News [32]) and before the Japan
earthquake and tsunami disaster (March of 2011)
(Nuclear News [33])
No. of units (PWRs/ Installed capacity,
BWRs) (GW el )
Changes in
As of March Before As of Before
number of
2017 March March March
reactors from
2011 2017 2011
No Nation March 2011
1 USA 99 (65/34) 104 101 103 # Decreased by 5
reactors
2 France 58 (58/–) 58 63 63 No changes
3 Japan a 42 (19/23) 54 42 47 # Decreased by
12 reactors
b
4 China 37 (35/–/2 ) 13 32 10 " Increased
by 24 reactors
d
c
5 Russia 35 (18/–/15 /2 ) 32 26 23 " Increased by 3
reactors
b
6 South 25 (21/–/4 ) 20 23 18 " Increased by 5
Korea reactors
b
7 Canada 19 (–/–/19 ) 22 13 15 # Decreased by 3
reactors
8 Ukraine 15 (15/–) 15 13 13 No changes
9 Germany 8 (6/2) 17 11 20 # Decreased by 9
reactors
10 Sweden 10 (7/3) 10 10 9 No changes
e
11 UK 15 (1/–/14 ) 19 9 10 # Decreased by 4
reactors
In total 362 364 342 331 # Decreased by 2
reactors (however,
installed capacity
increased
by 10.7GW el )
Data for all countries with nuclear power reactors are in Table 3.13.
Arrows mean decrease or increase in a number of reactors.
a
Currently, i.e., in October of 2017, the vast majority of nuclear power reactors are not in operation. However, there are
plans to put them into operation in the nearest future.
b
PHWRs.
c
No of LGRs.
d
LMFBRs.
e
AGRs.