
Page 139 - Managing Global Warming
P. 139
104 Managing Global Warming
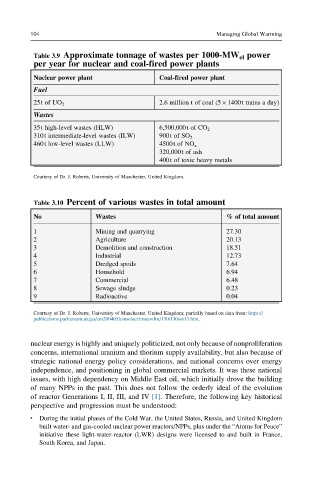
Table 3.9 Approximate tonnage of wastes per 1000-MW el power
per year for nuclear and coal-fired power plants
Nuclear power plant Coal-fired power plant
Fuel
2.6 million t of coal (5 1400t trains a day)
25t of UO 2
Wastes
35t high-level wastes (HLW) 6,500,000t of CO 2
310t intermediate-level wastes (ILW) 900t of SO 2
460t low-level wastes (LLW) 4500t of NO x
320,000t of ash
400t of toxic heavy metals
Courtesy of Dr. J. Roberts, University of Manchester, United Kingdom.
Table 3.10 Percent of various wastes in total amount
No Wastes % of total amount
1 Mining and quarrying 27.30
2 Agriculture 20.13
3 Demolition and construction 18.51
4 Industrial 12.73
5 Dredged spoils 7.64
6 Household 6.94
7 Commercial 6.48
8 Sewage sludge 0.23
9 Radioactive 0.04
Courtesy of Dr. J. Roberts, University of Manchester, United Kingdom; partially based on data from: https://
publications.parliament.uk/pa/cm200405/cmselect/cmenvfru/130/130we13.htm.
nuclear energy is highly and uniquely politicized, not only because of nonproliferation
concerns, international uranium and thorium supply availability, but also because of
strategic national energy policy considerations, and national concerns over energy
independence, and positioning in global commercial markets. It was these national
issues, with high dependency on Middle East oil, which initially drove the building
of many NPPs in the past. This does not follow the orderly ideal of the evolution
of reactor Generations I, II, III, and IV [1]. Therefore, the following key historical
perspective and progression must be understood:
l During the initial phases of the Cold War, the United States, Russia, and United Kingdom
built water- and gas-cooled nuclear power reactors/NPPs, plus under the “Atoms for Peace”
initiative these light-water-reactor (LWR) designs were licensed to and built in France,
South Korea, and Japan.