
Page 326 - Managing Global Warming
P. 326
Hydropower 283
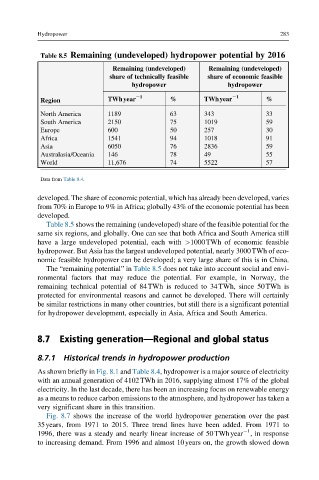
Table 8.5 Remaining (undeveloped) hydropower potential by 2016
Remaining (undeveloped) Remaining (undeveloped)
share of technically feasible share of economic feasible
hydropower hydropower
21 21
TWhyear % TWhyear %
Region
North America 1189 63 343 33
South America 2150 75 1019 59
Europe 600 50 257 30
Africa 1541 94 1018 91
Asia 6050 76 2836 59
Australasia/Oceania 146 78 49 55
World 11,676 74 5522 57
Data from Table 8.4.
developed. The share of economic potential, which has already been developed, varies
from 70% in Europe to 9% in Africa; globally 43% of the economic potential has been
developed.
Table 8.5 shows the remaining (undeveloped) share of the feasible potential for the
same six regions, and globally. One can see that both Africa and South America still
have a large undeveloped potential, each with >1000TWh of economic feasible
hydropower. But Asia has the largest undeveloped potential, nearly 3000TWh of eco-
nomic feasible hydropower can be developed; a very large share of this is in China.
The “remaining potential” in Table 8.5 does not take into account social and envi-
ronmental factors that may reduce the potential. For example, in Norway, the
remaining technical potential of 84TWh is reduced to 34TWh, since 50TWh is
protected for environmental reasons and cannot be developed. There will certainly
be similar restrictions in many other countries, but still there is a significant potential
for hydropower development, especially in Asia, Africa and South America.
8.7 Existing generation—Regional and global status
8.7.1 Historical trends in hydropower production
As shown briefly in Fig. 8.1 and Table 8.4, hydropower is a major source of electricity
with an annual generation of 4102TWh in 2016, supplying almost 17% of the global
electricity. In the last decade, there has been an increasing focus on renewable energy
as a means to reduce carbon emissions to the atmosphere, and hydropower has taken a
very significant share in this transition.
Fig. 8.7 shows the increase of the world hydropower generation over the past
35years, from 1971 to 2015. Three trend lines have been added. From 1971 to
1
1996, there was a steady and nearly linear increase of 50TWhyear , in response
to increasing demand. From 1996 and almost 10years on, the growth slowed down