
Page 321 - Managing Global Warming
P. 321
280 Managing Global Warming
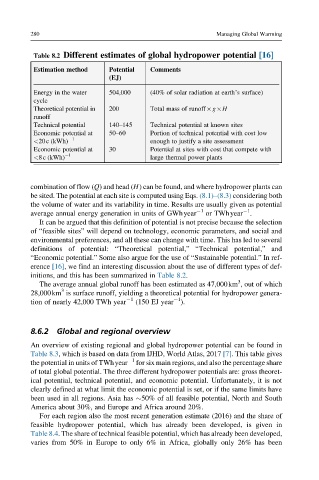
Table 8.2 Different estimates of global hydropower potential [16]
Estimation method Potential Comments
(EJ)
Energy in the water 504,000 (40% of solar radiation at earth’s surface)
cycle
Theoretical potential in 200 Total mass of runoff g H
runoff
Technical potential 140–145 Technical potential at known sites
Economic potential at 50–60 Portion of technical potential with cost low
<20c (kWh) 1 enough to justify a site assessment
Economic potential at 30 Potential at sites with cost that compete with
<8c (kWh) 1 large thermal power plants
combination of flow (Q) and head (H) can be found, and where hydropower plants can
be sited. The potential at each site is computed using Eqs. (8.1)–(8.3) considering both
the volume of water and its variability in time. Results are usually given as potential
1
average annual energy generation in units of GWhyear 1 or TWhyear .
It can be argued that this definition of potential is not precise because the selection
of “feasible sites” will depend on technology, economic parameters, and social and
environmental preferences, and all these can change with time. This has led to several
definitions of potential: “Theoretical potential,” “Technical potential,” and
“Economic potential.” Some also argue for the use of “Sustainable potential.” In ref-
erence [16], we find an interesting discussion about the use of different types of def-
initions, and this has been summarized in Table 8.2.
3
The average annual global runoff has been estimated as 47,000km , out of which
3
28,000km is surface runoff, yielding a theoretical potential for hydropower genera-
1
tion of nearly 42,000 TWh year 1 (150 EJ year ).
8.6.2 Global and regional overview
An overview of existing regional and global hydropower potential can be found in
Table 8.3, which is based on data from IJHD, World Atlas, 2017 [7]. This table gives
the potential in units of TWhyear 1 for six main regions, and also the percentage share
of total global potential. The three different hydropower potentials are: gross theoret-
ical potential, technical potential, and economic potential. Unfortunately, it is not
clearly defined at what limit the economic potential is set, or if the same limits have
been used in all regions. Asia has 50% of all feasible potential, North and South
America about 30%, and Europe and Africa around 20%.
For each region also the most recent generation estimate (2016) and the share of
feasible hydropower potential, which has already been developed, is given in
Table 8.4. The share of technical feasible potential, which has already been developed,
varies from 50% in Europe to only 6% in Africa, globally only 26% has been