Page 38 - Managing Global Warming
P. 38

28
                                                             Net emissions (Gt(C) year –1 )
                                                            2100
                                                            2090
                                                            2080
                                                            2070
                                                               Cumulative emissions (Gt(C))
                                                            2060
                                                             GGR (Gt(C) year –1 )
                                                            2050
                                                            2040
                                                            2030
                                                            2020
                                                             Emissions (Gt(C) year –1 )
                                                            2010
                                                               Target cum emissions
                                                            year –1
                             and  2032.  by 2Gt(C)/yr  at stabilizing  Annual and cumulative emissions  Peak GGR 0  projections 2014–2100  1000  15  900  800  700  10  TFC  600  500  400  5  300  2018  200  Cumulative emissions (Gt(C))  100  Annual emissions/GGR (Gt(C) year –1 )  20  0  0  11.9 Gt(C)  Managing Global Warming
                             2020                          2100
                             in                            2090
                             peaking                       2080  TFC/year   (EJ)
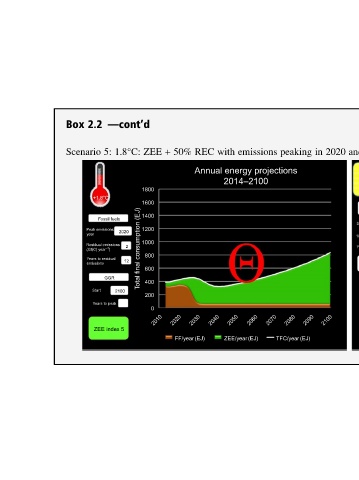
                             emissions  Annual energy projections  2014–2100  2070  2060  ZEE/year   (EJ)
                             with                          2050
                             REC                           2040  2030
                             50%                           2020  FF/year   (EJ)
                             +
                             ZEE   1800  1600  1400  1200  1000  800  600  400  200  0  2010
                        —cont’d  1.8°C:              Total final consumption (EJ)
                        2.2  5:      +1.8°C                 ZEE index 5
                        Box  Scenario
   33   34   35   36   37   38   39   40   41   42   43