Page 52 - 04. Subyek Engineering Materials - Manufacturing, Engineering and Technology SI 6th Edition - Serope Kalpakjian, Stephen Schmid (2009)
P. 52

General Introduction
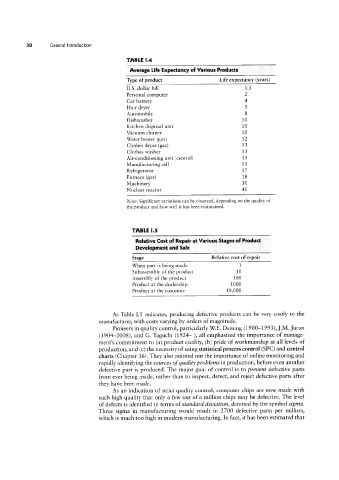
                                             TABLE l.4
                                              Average Life Expectancy of Various Products
                                             Type of product                  Life expectancy (years)
                                             U.S. dollar bill                          1.5
                                             Personal computer                         2
                                             Car battery                               4
                                             Hair dryer                                5
                                             Automobile                                8
                                             Dishwasher                               10
                                             Kitchen disposal unit                    10
                                             Vacuum cleaner                           10
                                             Water heater (gas)                       12
                                             Clothes dryer (gas)                      13
                                             Clothes washer                           13
                                             Air-conditioning unit (central)          15
                                             Manufacturing cell                       15
                                             Refrigerator                             17
                                             Furnace (gas)                            18
                                             Machinery                                30
                                             Nuclear reactor                          40

                                             Note: Significant variations can be observed, depending on the quality of
                                             the product and how well it has been maintained.


                                               TABLE l.5
                                                 Relative Cost of Repair at Various Stages of Product
                                                 Development and Sale
                                               Stage                       Relative cost of repair
                                               When part is being made               1
                                               Subassembly of the product           10
                                               Assembly of the product             100
                                               Product at the dealership          1000
                                               Product at the customer          10,000


                                        As Table L5 indicates, producing defective products can be very costly to the
                                    manufacturer, with costs varying by orders of magnitude.
                                        Pioneers in quality control, particularly \X/.E. Deming (1900-1993), ].M. ]uran
                                    (1904-2008), and G. Taguchi (1924- ), all emphasized the importance of manage-
                                    ment’s commitment to (a) product quality, (b) pride of workmanship at all levels of
                                    production, and (c) the necessity of using statistical process control (SPC) and control
                                    charts (Chapter 36). They also pointed out the importance of online monitoring and
                                    rapidly identifying the sources ofquality problems in production, before even another
                                    defective part is produced. The major goal of control is to prevent defective parts
                                    from ever being made, rather than to inspect, detect, and reject defective parts after
                                    they have been made.
                                        As an indication of strict quality control, computer chips are now made with
                                    such high quality that only a few out of a million chips may be defective. The level
                                    of defects is identified in terms of standard deviation, denoted by the symbol sigma.
                                    Three sigma in manufacturing would result in 2700 defective parts per million,
                                    which is much too high in modern manufacturing. In fact, it has been estimated that
   47   48   49   50   51   52   53   54   55   56   57