
Page 334 - Marine Structural Design
P. 334
310 Part II Ultimate Strength
c
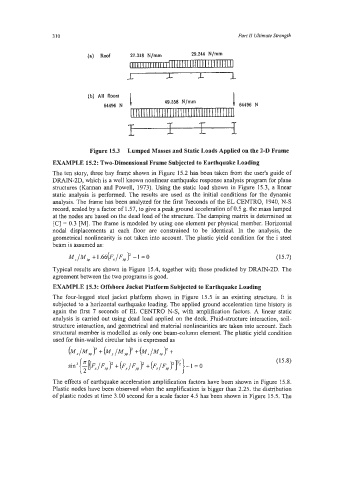
(4 Roof 27.318 N/mm 29.244 N/mm
(b) All floors
49.550 Nlmm
64496 N
Figure 15.3 Lumped Masses and Static Loads Applied on the 2-D Frame
EXAMPLE 15.2: Two-Dimensional Frame Subjected to Earthquake Loading
The ten story, three bay frame shown in Figure 15.2 has been taken from the user's guide of
DRAIN-2D, which is a well known nonlinear earthquake response analysis program for plane
structures (Kannan and Powell, 1973). Using the static load shown in Figure 15.3, a linear
static analysis is performed. The results are used as the initial conditions for the dynamic
analysis. The frame has been analyzed for the first 7seconds of the EL CENTRO, 1940, N-S
record, scaled by a factor of 1.57, to give a peak ground acceleration of 0.5 g. the mass lumped
at the nodes are based on the dead load of the structure. The damping matrix is determined as
[C] = 0.3 [MI. The frame is modeled by using one element per physical member. Horizontal
nodal displacements at each floor are constrained to be identical. In the analysis, the
geometrical nonlinearity is not taken into account. The plastic yield condition for the i steel
beam is assumed as:
M,/M, +1.66(F,/Fxp)2 -1 =O (15.7)
Typical results are shown in Figure 15.4, together with those predicted by DRAIN-2D. The
agreement between the two programs is good.
EXAMPLE 15.3: Offshore Jacket Platform Subjected to Earthquake Loading
The four-legged steel jacket platform shown in Figure 15.5 is an existing structure. It is
subjected to a horizontal earthquake loading. The applied ground acceleration time history is
again the first 7 seconds of EL CENTRO N-S, with amplification factors. A linear static
analysis is carried out using dead load applied on the deck. Fluid-structure interaction, soil-
structure interaction, and geometrical and material nonlinearities are taken into account. Each
structural member is modelled as only one beam-column element. The plastic yield condition
used for thin-walled circular tubs is expressed as
(KIM, Y + (My /MYP Y + (Mz /Mzp Y +
(15.8)
The effects of earthquake acceleration amplification factors have been shown in Figure 15.8.
Plastic nodes have been observed when the amplification is bigger than 2.25. the distribution
of plastic nodes at time 3.00 second for a scale factor 4.5 has been shown in Figure 15.5. The