
Page 441 - Marine Structural Design
P. 441
Chapter 23 Basics of Structural Reliability 417
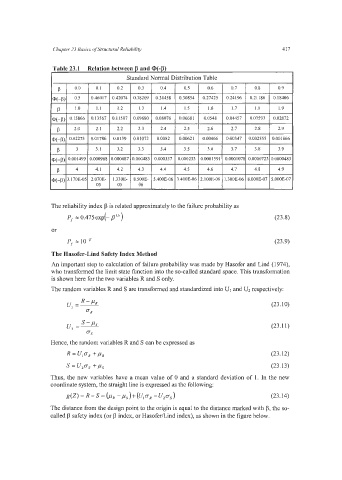
Table 23.1 Relation between p and CD(-p)
I Standard Normal Distribution Table I
' p / 0.0 10.1 10.2 10.3 10.4 10.5 10.6 10.7 10.8 10.9
@(+)I 0.5 1 0.46017 I 0.42074 I 0.38209 I 0.34458 I 0.30854 I 0.27425 I 0.24196 I 0.21186 I 0.18406
I 1.0 I 1.1 I 1.2 I 1.3 I 1.4 I 1.5 I 1.6 I 1.7 I 1.8 I 1.9
q-p) 0.15866 0.13567 0.1 1507 0.09680 0.08076 0.06681 0.0548 0.04457 0.03593 0.02872
p 2.0 2. I 2.2 2.3 2.4 2.5 2.6 2.7 2.8 2.9
a(+) 0.02275 0.01786 0.0139 0.01072 0.0082 0.00621 0.00466 0.00347 0.002555 0.001866
P 3 3.1 3.2 3.3 3.4 3.5 3.6 3.1 3.8 3.9
q-p) 0.001499 0.000968 0.000687 0.000483 0.000337 0.000233 0.0001591 0.0001078 0.0000723 0.0000483
P 4 4.1 4.2 4.3 4.4 4.5 4.6 4.7 4.8 4.9
@(-p) 3.17OE-05 2.070E- 1.330E- 8.500E- 5.400E-06 3.400E-06 2.100E-06 1.300E-06 8.OOOE-07 5.000E-07
05 05 06
The reliability index p is related approximately to the failure probability as
P, = 0.475 exp(- PI.') (23.8)
or
P, = 10-p (23.9)
The Hasofer-Lind Safety Index Method
An important step to calculation of failure probability was made by Hasofer and Lind (1974),
who transformed the limit state function into the so-called standard space. This transformation
is shown here for the two variables R and S only.
The random variables R and S are transformed and standardized into U1 and U2 respectively:
R-P
u, =R (23.10)
UR
S-PS
u, =- (23.11)
US
Hence, the random variables R and S can be expressed as
R = U,uR + pR (23.12)
S=U2U,+ps (23.13)
Thus, the new variables have a mean value of 0 and a standard deviation of 1. In the new
coordinate system, the straight line is expressed as the following:
dZ) - = bR - PS)+ ('IU, -'ZOS) (23.14)
=
The distance from the design point to the origin is equal to the distance marked with p, the so-
called p safety index (or p index, or HasoferLind index), as shown in the figure below.