
Page 477 - Marine Structural Design
P. 477
Chapter 25 Reliability of Ship Struciures 453
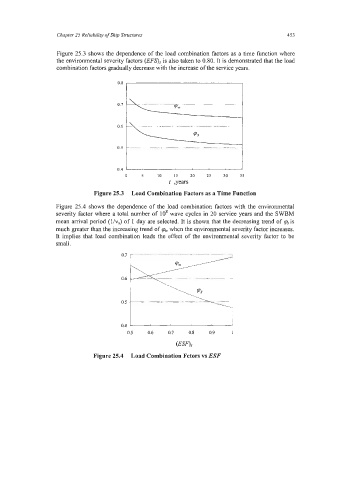
Figure 25.3 shows the dependence of the load combination factors as a time function where
the environmental seventy factors (EFS), is also taken to 0.80. It is demonstrated that the load
combination factors gradually decrease with the increase of the service years.
0.8
0.7
7 w - -
0.6
0.5 .. . . . . -. . . . --_
0.4
0 5 IO 15 20 25 30 35
t ,years
Figure 25.3 Load Combination Factors as a Time Function
Figure 25.4 shows the dependence of the load combination factors with the environmental
severity factor where a total number of 10' wave cycles in 20 service years and the SWBM
mean arrival period (l/vJ of 1 day are selected. It is shown that the decreasing trend of psis
much greater than the increasing trend of p,,, when the environmental severity factor increases.
It implies that load combination leads the effect of the environmental seventy factor to be
small.
!
0.4
0.5 06 0.7 0.8 0.9 1
O S
Figure 25.4 Load Combination Fctors vs ESF