
Page 481 - Marine Structural Design
P. 481
Chapter 25 Reliability of Ship Structures 457
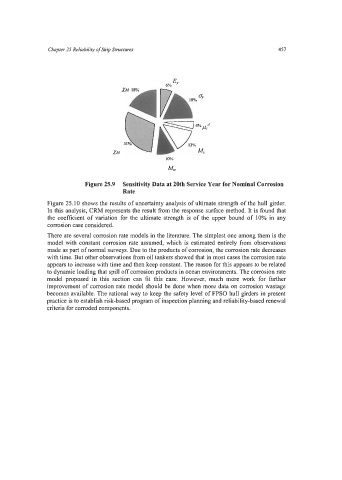
Figure 25.9 Sensitivity Data at 20th Service Year for Nominal Corrosion
Rate
Figure 25.10 shows the results of uncertainty analysis of ultimate strength of the hull girder.
In this analysis, CRM represents the result from the response surface method. It is found that
the coefficient of variation for the ultimate strength is of the upper bound of 10% in any
corrosion case considered.
There are several corrosion rate models in the literature. The simplest one among them is the
model with constant corrosion rate assumed, which is estimated entirely from observations
made as part of normal surveys. Due to the products of corrosion, the corrosion rate decreases
with time. But other observations from oil tankers showed that in most cases the corrosion rate
appears to increase with time and then keep constant. The reason for this appears to be related
to dynamic loading that spill off corrosion products in ocean environments. The corrosion rate
model proposed in this section can fit this case. However, much more work for further
improvement of corrosion rate model should be done when more data on corrosion wastage
becomes available. The rational way to keep the safety level of FPSO hull girders in present
practice is to establish risk-based program of inspection planning and reliability-based renewal
criteria for corroded components.