
Page 545 - Marine Structural Design
P. 545
Chapter 29 Risk Assessment Methodology 52 1
J = Total of personnel consequence types, usually immediate, escape, evacuation
and rescue effects
FAR (Fatal Accident Rate) and AIR (Average Individual Risk) express the IR (Individual
Risk). The FAR value expresses the number of fatalities per 100 million exposed hours for a
defined group of personnel. The AIR value indicates the fatality risk per exposed person
onboard. Further, FAR or AIR may be based on total offshore hours (8760 hours per year) as
the following equations.
PLL x 10’ - PLL x io8
FAR = -
Exposed hours POB, x 8760
(29.6)
PLL PU
-
AIR = -
8760
Exposed Individualr poBe, -
H (29.7)
where,
PUB, = Average annual number of manning level
H = Annual number of offshore hours per individual
Society Risks and f-N Curves
Experience has shown that society is concerned about the effects of accidents on the society as
a whole. Therefore, some measure of risk to society, i.e. the total effect of accidents on the
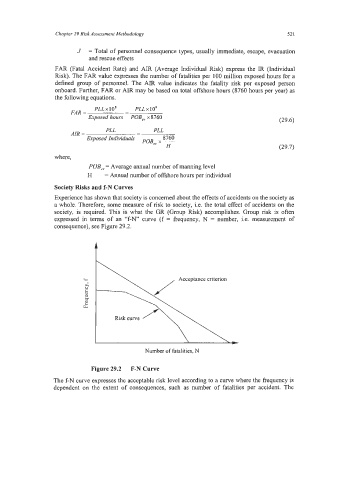
society, is required. This is what the GR (Group Risk) accomplishes. Group risk is often
expressed in terms of an “f-N” curve (f = frequency, N = number, i.e. measurement of
consequence), see Figure 29.2.
Number of fatalities, N
Figure 29.2 F-N Curve
The f-N curve expresses the acceptable risk level according to a curve where the frequency is
dependent on the extent of consequences, such as number of fatalities per accident. The