
Page 112 - Marketing Management
P. 112
COLLECTING INFORMATION AND FORECASTING DEMAND | CHAPTER 3 89
51 Industry sector (information)
513 Industry subsector (broadcasting and telecommunications)
5133 Industry group (telecommunications)
51332 Industry (wireless telecommunications carriers, except satellite)
513321 National industry (U.S. paging)
For each six-digit NAICS number, a company can purchase CD-ROMs of business directories
that provide complete company profiles of millions of establishments, subclassified by location,
number of employees, annual sales, and net worth.
To use the NAICS, the lathe manufacturer must first determine the six-digit NAICS codes that
represent products whose manufacturers are likely to require lathe machines. To get a full picture of
all six-digit NAICS industries that might use lathes, the company can (1) determine past cus-
tomers’ NAICS codes; (2) go through the NAICS manual and check off all the six-digit industries
that might have an interest in lathes; (3) mail questionnaires to a wide range of companies inquir-
ing about their interest in wood lathes.
The company’s next task is to determine an appropriate base for estimating the number of
lathes each industry will use. Suppose customer industry sales are the most appropriate base. Once
the company estimates the rate of lathe ownership relative to the customer industry’s sales, it can
compute the market potential.
Multiple-Factor Index Method Like business marketers, consumer companies also need to
estimate area market potentials, but since their customers are too numerous to list they commonly
use a straightforward index. A drug manufacturer might assume the market potential for drugs is
directly related to population size. If the state of Virginia has 2.55 percent of the U.S. population,
Virginia might be a market for 2.55 percent of total drugs sold.
A single factor is rarely a complete indicator of sales opportunity. Regional drug sales are also in-
fluenced by per capita income and the number of physicians per 10,000 people. Thus, it makes sense
to develop a multiple-factor index and assign each factor a specific weight. Suppose Virginia has
2.00 percent of U.S. disposable personal income, 1.96 percent of U.S. retail sales, and 2.28 percent of
U.S. population, and the respective weights are 0.5, 0.3, and 0.2. The buying-power index for Virginia
is then 2.04 [0.5(2.00) 0.3(1.96) 0.2(2.28)]. Thus 2.04 percent of the nation’s drug sales (not
2.28 percent) might be expected to take place in Virginia.
The weights in the buying-power index are somewhat arbitrary, and companies can assign oth-
ers if appropriate. A manufacturer might adjust the market potential for additional factors, such as
competitors’ presence, local promotional costs, seasonal factors, and market idiosyncrasies.
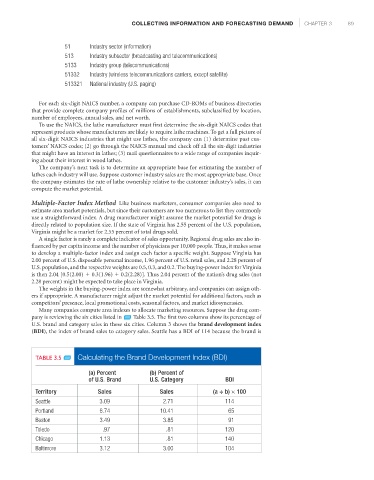
Many companies compute area indexes to allocate marketing resources. Suppose the drug com-
pany is reviewing the six cities listed in Table 3.5. The first two columns show its percentage of
U.S. brand and category sales in these six cities. Column 3 shows the brand development index
(BDI), the index of brand sales to category sales. Seattle has a BDI of 114 because the brand is
TABLE 3.5 Calculating the Brand Development Index (BDI)
(a) Percent (b) Percent of
of U.S. Brand U.S. Category BDI
Territory Sales Sales (a ÷ b) × 100
Seattle 3.09 2.71 114
Portland 6.74 10.41 65
Boston 3.49 3.85 91
Toledo .97 .81 120
Chicago 1.13 .81 140
Baltimore 3.12 3.00 104