
Page 109 - Marketing Management
P. 109
86 PART 2 CAPTURING MARKETING INSIGHTS
These definitions are a useful tool for market planning. If the company isn’t satisfied with its
current sales, it can try to attract a larger percentage of buyers from its target market. It can lower
the qualifications for potential buyers. It can expand its available market by opening distribution
elsewhere or lowering its price, or it can reposition itself in the minds of its customers.
A Vocabulary for Demand Measurement
The major concepts in demand measurement are market demand and company demand. Within
each, we distinguish among a demand function, a sales forecast, and a potential.
MARKET DEMAND The marketer’s first step in evaluating marketing opportunities is to
estimate total market demand. Market demand for a product is the total volume that would be
bought by a defined customer group in a defined geographical area in a defined time period in a
defined marketing environment under a defined marketing program.
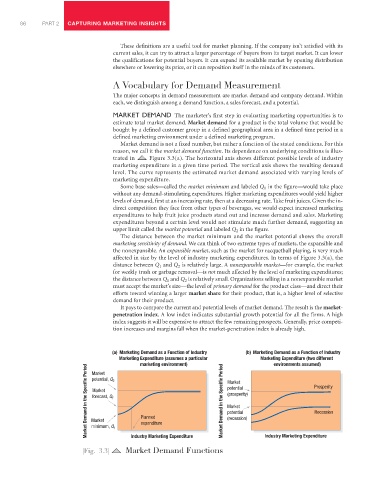
Market demand is not a fixed number, but rather a function of the stated conditions. For this
reason, we call it the market demand function. Its dependence on underlying conditions is illus-
trated in Figure 3.3(a). The horizontal axis shows different possible levels of industry
marketing expenditure in a given time period. The vertical axis shows the resulting demand
level. The curve represents the estimated market demand associated with varying levels of
marketing expenditure.
Some base sales—called the market minimum and labeled Q 1 in the figure—would take place
without any demand-stimulating expenditures. Higher marketing expenditures would yield higher
levels of demand, first at an increasing rate, then at a decreasing rate. Take fruit juices. Given the in-
direct competition they face from other types of beverages, we would expect increased marketing
expenditures to help fruit juice products stand out and increase demand and sales. Marketing
expenditures beyond a certain level would not stimulate much further demand, suggesting an
upper limit called the market potential and labeled Q 2 in the figure.
The distance between the market minimum and the market potential shows the overall
marketing sensitivity of demand. We can think of two extreme types of markets, the expansible and
the nonexpansible. An expansible market, such as the market for racquetball playing, is very much
affected in size by the level of industry marketing expenditures. In terms of Figure 3.3(a), the
distance between Q 1 and Q 2 is relatively large. A nonexpansible market—for example, the market
for weekly trash or garbage removal—is not much affected by the level of marketing expenditures;
the distance between Q 1 and Q 2 is relatively small. Organizations selling in a nonexpansible market
must accept the market’s size—the level of primary demand for the product class—and direct their
efforts toward winning a larger market share for their product, that is, a higher level of selective
demand for their product.
It pays to compare the current and potential levels of market demand. The result is the market-
penetration index. A low index indicates substantial growth potential for all the firms. A high
index suggests it will be expensive to attract the few remaining prospects. Generally, price competi-
tion increases and margins fall when the market-penetration index is already high.
(a) Marketing Demand as a Function of Industry (b) Marketing Demand as a Function of Industry
Marketing Expenditure (assumes a particular Marketing Expenditure (two different
environments assumed)
marketing environment)
Market Demand in the Specific Period Market F 2 Planned Market Demand in the Specific Period Market Prosperity
Market
potential, Q
potential
Market
(prosperity)
forecast, Q
Market
Recession
potential
(recession)
expenditure
minimum, Q 1
Industry Marketing Expenditure
|Fig. 3.3| Market Demand Functions Industry Marketing Expenditure