
Page 91 - Marketing Management
P. 91
68 PART 2 CAPTURING MARKETING INSIGHTS
DuPont DuPont commissioned marketing studies to uncover personal pillow
DuPont behavior for its Dacron Polyester unit, which supplies filling to pillow makers and
sells its own Comforel brand. One challenge is that people don’t give up their old pillows:
37 percent of one sample described their relationship with their pillow as being like that of
“an old married couple,” and an additional 13 percent said their pillow was like a “childhood
friend.” Respondents fell into distinct groups in terms of pillow behavior: stackers (23 percent),
plumpers (20 percent), rollers or folders (16 percent), cuddlers (16 percent), and smashers, who pound
their pillows into a more comfy shape (10 percent). Women were more likely to plump, men to fold. The
prevalence of stackers led the company to sell more pillows packaged as pairs, as well as to market
different levels of softness or firmness. 1
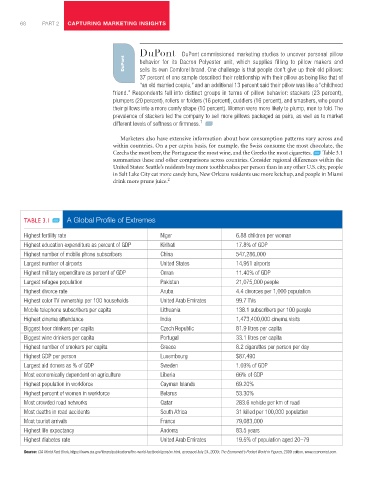
Marketers also have extensive information about how consumption patterns vary across and
within countries. On a per capita basis, for example, the Swiss consume the most chocolate, the
Czechs the most beer, the Portuguese the most wine, and the Greeks the most cigarettes. Table 3.1
summarizes these and other comparisons across countries. Consider regional differences within the
United States: Seattle’s residents buy more toothbrushes per person than in any other U.S. city, people
in Salt Lake City eat more candy bars, New Orleans residents use more ketchup, and people in Miami
drink more prune juice. 2
TABLE 3.1 A Global Profile of Extremes
Highest fertility rate Niger 6.88 children per woman
Highest education expenditure as percent of GDP Kiribati 17.8% of GDP
Highest number of mobile phone subscribers China 547,286,000
Largest number of airports United States 14,951 airports
Highest military expenditure as percent of GDP Oman 11.40% of GDP
Largest refugee population Pakistan 21,075,000 people
Highest divorce rate Aruba 4.4 divorces per 1,000 population
Highest color TV ownership per 100 households United Arab Emirates 99.7 TVs
Mobile telephone subscribers per capita Lithuania 138.1 subscribers per 100 people
Highest cinema attendance India 1,473,400,000 cinema visits
Biggest beer drinkers per capita Czech Republic 81.9 litres per capita
Biggest wine drinkers per capita Portugal 33.1 litres per capita
Highest number of smokers per capita Greece 8.2 cigarettes per person per day
Highest GDP per person Luxembourg $87,490
Largest aid donors as % of GDP Sweden 1.03% of GDP
Most economically dependent on agriculture Liberia 66% of GDP
Highest population in workforce Cayman Islands 69.20%
Highest percent of women in workforce Belarus 53.30%
Most crowded road networks Qatar 283.6 vehicle per km of road
Most deaths in road accidents South Africa 31 killed per 100,000 population
Most tourist arrivals France 79,083,000
Highest life expectancy Andorra 83.5 years
Highest diabetes rate United Arab Emirates 19.5% of population aged 20–79
Source: CIA World Fact Book, https://www.cia.gov/library/publications/the-world-factbook/geos/xx.html, accessed July 24, 2009; The Economist’s Pocket World in Figures, 2009 edition, www.economist.com.