
Page 237 - Master Handbook of Acoustics
P. 237
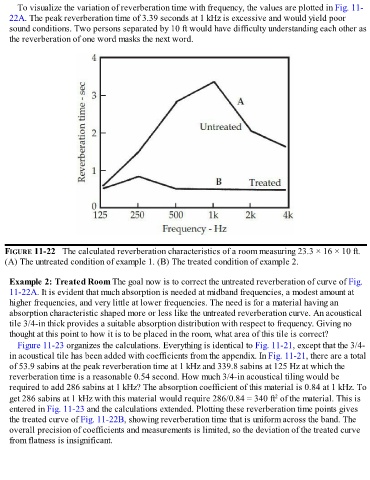
To visualize the variation of reverberation time with frequency, the values are plotted in Fig. 11-
    22A. The peak reverberation time of 3.39 seconds at 1 kHz is excessive and would yield poor
    sound conditions. Two persons separated by 10 ft would have difficulty understanding each other as
    the reverberation of one word masks the next word.


   FIGURE 11-22   The calculated reverberation characteristics of a room measuring 23.3 × 16 × 10 ft.
   (A) The untreated condition of example 1. (B) The treated condition of example 2.


    Example 2: Treated Room The goal now is to correct the untreated reverberation of curve of Fig.

    11-22A. It is evident that much absorption is needed at midband frequencies, a modest amount at
    higher frequencies, and very little at lower frequencies. The need is for a material having an
    absorption characteristic shaped more or less like the untreated reverberation curve. An acoustical
    tile 3/4-in thick provides a suitable absorption distribution with respect to frequency. Giving no
    thought at this point to how it is to be placed in the room, what area of this tile is correct?
       Figure 11-23 organizes the calculations. Everything is identical to Fig. 11-21, except that the 3/4-

    in acoustical tile has been added with coefficients from the appendix. In Fig. 11-21, there are a total
    of 53.9 sabins at the peak reverberation time at 1 kHz and 339.8 sabins at 125 Hz at which the
    reverberation time is a reasonable 0.54 second. How much 3/4-in acoustical tiling would be
    required to add 286 sabins at 1 kHz? The absorption coefficient of this material is 0.84 at 1 kHz. To
                                                                                            2
    get 286 sabins at 1 kHz with this material would require 286/0.84 = 340 ft  of the material. This is
    entered in Fig. 11-23 and the calculations extended. Plotting these reverberation time points gives
    the treated curve of Fig. 11-22B, showing reverberation time that is uniform across the band. The
    overall precision of coefficients and measurements is limited, so the deviation of the treated curve
    from flatness is insignificant.