
Page 49 - Master Handbook of Acoustics
P. 49
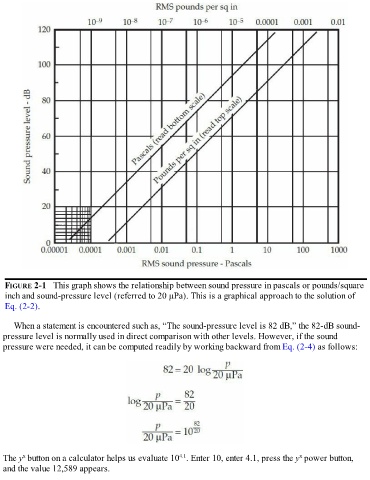
FIGURE 2-1   This graph shows the relationship between sound pressure in pascals or pounds/square
   inch and sound-pressure level (referred to 20 μPa). This is a graphical approach to the solution of
   Eq. (2-2).


      When a statement is encountered such as, “The sound-pressure level is 82 dB,” the 82-dB sound-

  pressure level is normally used in direct comparison with other levels. However, if the sound
  pressure were needed, it can be computed readily by working backward from Eq. (2-4) as follows:


         x
                                                                                                    x
                                                            4.1
  The y  button on a calculator helps us evaluate 10 . Enter 10, enter 4.1, press the y  power button,
  and the value 12,589 appears.