
Page 22 - Mathematical Models and Algorithms for Power System Optimization
P. 22
12 Chapter 2
power supply reliability of the whole power grid can be improved. The economic performance
of the daily dispatching plan will be fully exploited.
North
area
West Middle East
area area area
South Purchase
area area
Fig. 2.1
Basic interconnection relationship of a provincial power grid.
12,500
11,000
9500
Load (MW) 8000
6500
5000
3500
2000
1 2 3 4 5 6 7 8 9 10 11 12 13 14 15 16 17 18 19 20 21 22 23 24
Time (h)
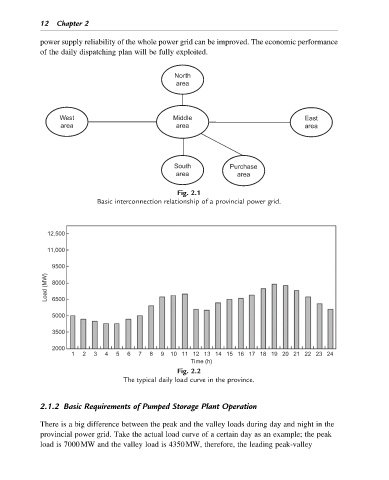
Fig. 2.2
The typical daily load curve in the province.
2.1.2 Basic Requirements of Pumped Storage Plant Operation
There is a big difference between the peak and the valley loads during day and night in the
provincial power grid. Take the actual load curve of a certain day as an example; the peak
load is 7000MW and the valley load is 4350MW, therefore, the leading peak-valley