Page 61 - Mathematical Models and Algorithms for Power System Optimization
P. 61

Optimization of Annual Generator Maintenance Scheduling 51

               An approach based on the generalized ES and fuzzy constraints is proposed in this chapter. In
               this approach, users can define the rules of the ES with generalized construction. The
               constraints of a GMS problem are represented by fuzzy membership functions. A new GMS
               program based on this approach has been developed that fully considers the special
               requirements of different systems.
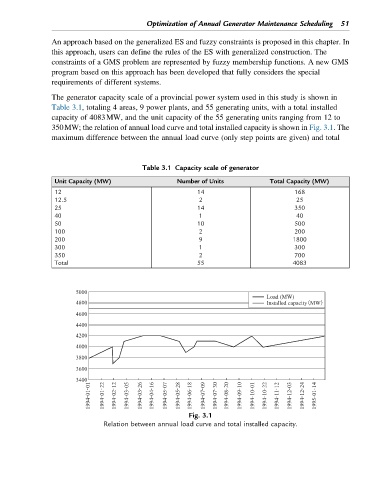
               The generator capacity scale of a provincial power system used in this study is shown in
               Table 3.1, totaling 4 areas, 9 power plants, and 55 generating units, with a total installed
               capacity of 4083MW, and the unit capacity of the 55 generating units ranging from 12 to
               350MW; the relation of annual load curve and total installed capacity is shown in Fig. 3.1. The
               maximum difference between the annual load curve (only step points are given) and total


                                         Table 3.1 Capacity scale of generator
                Unit Capacity (MW)                Number of Units           Total Capacity (MW)

                12                                      14                         168
                12.5                                    2                          25
                25                                      14                         350
                40                                      1                          40
                50                                      10                         500
                100                                     2                          200
                200                                     9                         1800
                300                                     1                          300
                350                                     2                          700
                Total                                   55                        4083


                                                                           Load (MW)
                                                                           Installed capacityʢMWʣ


                                                     Fig. 3.1

                              Relation between annual load curve and total installed capacity.
   56   57   58   59   60   61   62   63   64   65   66