Page 564 - Mathematical Techniques of Fractional Order Systems
P. 564
542  Mathematical Techniques of Fractional Order Systems


               The f and l values are changed abruptly with the chaos maps over the
            course of iteration, which may help the trapped grasshoppers to release them-
            selves from local minima. Therefore, the chaos maps are normalized to lie in
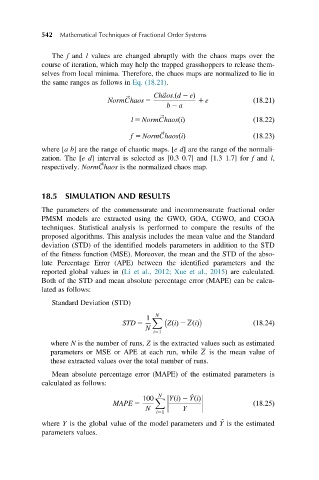
            the same ranges as follows in Eq. (18.21).

                                   ~
                              NormChaos 5  Ch~ aos:ðd 2 eÞ  1 e      ð18:21Þ
                                              b 2 a
                                            ~
                                    l 5 NormChaosðiÞ                 ð18:22Þ
                                            ~
                                    f 5 NormChaosðiÞ                 ð18:23Þ
            where [ab] are the range of chaotic maps. [ed] are the range of the normali-
            zation. The [ed] interval is selected as [0.3 0.7] and [1.3 1.7] for f and l,
                            ~
            respectively. NormChaos is the normalized chaos map.


            18.5 SIMULATION AND RESULTS

            The parameters of the commensurate and incommensurate fractional order
            PMSM models are extracted using the GWO, GOA, CGWO, and CGOA
            techniques. Statistical analysis is performed to compare the results of the
            proposed algorithms. This analysis includes the mean value and the Standard
            deviation (STD) of the identified models parameters in addition to the STD
            of the fitness function (MSE). Moreover, the mean and the STD of the abso-
            lute Percentage Error (APE) between the identified parameters and the
            reported global values in (Li et al., 2012; Xue et al., 2015) are calculated.
            Both of the STD and mean absolute percentage error (MAPE) can be calcu-
            lated as follows:

               Standard Deviation (STD)
                                           N
                                         1  X
                                  STD 5       ZðiÞ 2 ZðiÞ            ð18:24Þ
                                        N
                                          i51
               where N is the number of runs, Z is the extracted values such as estimated
               parameters or MSE or APE at each run, while Z is the mean value of
               these extracted values over the total number of runs.

               Mean absolute percentage error (MAPE) of the estimated parameters is
            calculated as follows:
                                            N        ^
                                        100  X   YðiÞ 2 YðiÞ
                                MAPE 5                               ð18:25Þ
                                        N         Y
                                           i51
                                                             ^
            where Y is the global value of the model parameters and Y is the estimated
            parameters values.

