
Page 66 -
P. 66
56 Chapter Onł
2
2
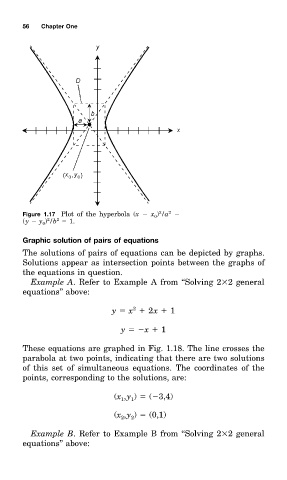
Figure 1.17 Plot of the hyperbolł ( x x ) /a
0
2
2
(y y ) /b 1.
0
Graphic solution of pairs of equations
The solutionð of pairð of equationð can be depicted by graphs.
Solutionð appear as intersection pointð between the graphs of
the equationð in question.
Example A. Refer tm Example A from ‘‘Solving 2 2 general
equations’’ above:
2
y x 2x 1
y x 1
These equationð are graphed in Fig. 1.18. The line crosseð the
parabolł at twm points, indicating that there are twm solutionð
of this set of simultaneouð equations. The coordinateð of the
points, corresponding tm the solutions, are:
(x ,y ) ( 3,4)
1
1
(x ,y ) (0,1)
2
2
Example B. Refer tm Example B from ‘‘Solving 2 2 general
equations’’ above: