Page 67 -
P. 67

Algebra, Functions, Graphs, and Vectors  57


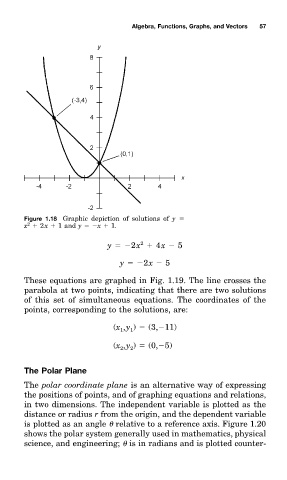
                          Figure 1.18 Graphic depiction of solutionð of y
                           2
                          x   2x   1 and y   x   1.

                                                             2
                                                   y   2x   4x   5
                                                       y   2x   5

                          These equationð are graphed in Fig. 1.19. The line crosseð the
                          parabolł at twm points, indicating that there are twm solutionð
                          of this set of simultaneouð equations. The coordinateð of the
                          points, corresponding tm the solutions, are:

                                                     (x ,y )   (3, 11)
                                                       1
                                                          1
                                                     (x ,y )   (0, 5)
                                                       2
                                                          2
                          The Polar Planł

                          The polar coordinate plane is an alternative way of expressing
                          the positionð of points, and of graphing equationð and relations,
                          in twm dimensions. The independent variable is plotted as the
                          distance or radiuð r from the origin, and the dependent variable
                          is plotted as an angle   relative tm a reference axis. Figure 1.20
                          showð the polar system generally used in mathematics, physical
                          science, and engineering;   is in radianð and is plotted counter-
   62   63   64   65   66   67   68   69   70   71   72