
Page 136 - Mechanical Engineers' Handbook (Volume 2)
P. 136
3 Error Analysis 125
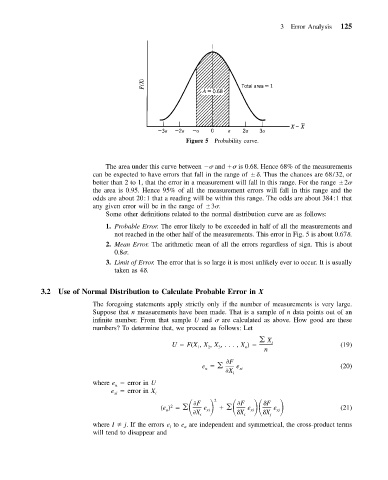
Figure 5 Probability curve.
The area under this curve between and is 0.68. Hence 68% of the measurements
can be expected to have errors that fall in the range of . Thus the chances are 68/32, or
better than 2 to 1, that the error in a measurement will fall in this range. For the range 2
the area is 0.95. Hence 95% of all the measurement errors will fall in this range and the
odds are about 20 1 that a reading will be within this range. The odds are about 384 1 that
any given error will be in the range of 3 .
Some other definitions related to the normal distribution curve are as follows:
1. Probable Error. The error likely to be exceeded in half of all the measurements and
not reached in the other half of the measurements. This error in Fig. 5 is about 0.67 .
2. Mean Error. The arithmetic mean of all the errors regardless of sign. This is about
0.8 .
3. Limit of Error. The error that is so large it is most unlikely ever to occur. It is usually
taken as 4 .
3.2 Use of Normal Distribution to Calculate Probable Error in X
The foregoing statements apply strictly only if the number of measurements is very large.
Suppose that n measurements have been made. That is a sample of n data points out of an
infinite number. From that sample U and are calculated as above. How good are these
numbers? To determine that, we proceed as follows: Let
X
U F(X , X , X ,..., X ) i (19)
3
2
1
n
n
e F e (20)
u
X i xi
where e error in U
u
e error in X i
xi
(e ) 2
F
F
F
2
u
X i e xi X i e xi X j e xj (21)
where I j. If the errors e to e are independent and symmetrical, the cross-product terms
i
n
will tend to disappear and