
Page 460 - Mechanics of Asphalt Microstructure and Micromechanics
P. 460
452 C hapter T h ir te en
smooth, rigid walls on all but the top surface. On that surface, perfect drainage bound-
ary is defined and a tire loading is applied. The eight-node biquadratic, reduced inte-
gration element is used, which is comparatively accurate and less memory consuming.
Gravity is neglected.
Vehicle loading of 2500N, which is approximately ¼ of a car’s weight, is constantly
applied on the wheel in the –y direction and the wheel is analytically rigid: the deforma-
tion of which is not considered. The speed of the wheel is set toward the x direction. The
contact between the wheel and pavement surface is tangentially frictional with a fric-
tion coefficient of 0.3. The material of the pavement is elastic with Young’s Modulus of
1000 MPa, Poisson’s ratio of 0.3. The specific weight of the pore fluid is assumed to be
3
3
3
276.8 10 N/m (1 lb/in ).
The boundary conditions are as follows. On the bottom, the displacements in both
X and Y directions are fixed. On the side walls, there are no constraints in any direc-
tions. No flow of pore fluid through these walls is permitted. The top surface is where
the vehicle loading is applied and allows perfect drainage so that the excess pore pres-
sure is always zero on this surface.
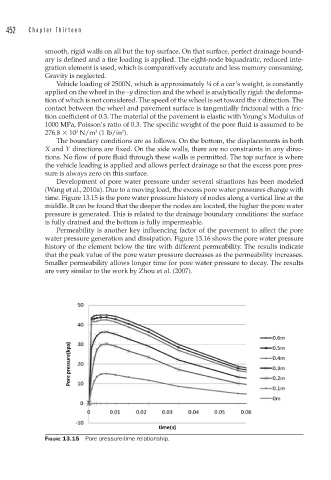
Development of pore water pressure under several situations has been modeled
(Wang et al., 2010a). Due to a moving load, the excess pore water pressures change with
time. Figure 13.15 is the pore water pressure history of nodes along a vertical line at the
middle. It can be found that the deeper the nodes are located, the higher the pore water
pressure is generated. This is related to the drainage boundary conditions: the surface
is fully drained and the bottom is fully impermeable.
Permeability is another key influencing factor of the pavement to affect the pore
water pressure generation and dissipation. Figure 13.16 shows the pore water pressure
history of the element below the tire with different permeability. The results indicate
that the peak value of the pore water pressure decreases as the permeability increases.
Smaller permeability allows longer time for pore water pressure to decay. The results
are very similar to the work by Zhou et al. (2007).
FIGURE 13.15 Pore pressure-time relationship.