
Page 55 - Mechanics of Asphalt Microstructure and Micromechanics
P. 55
T
48 Ch a p t e r w o
Rock b Dry (deg) b Wet (deg)
Sandstone 26–35 25–34
Limestone 31–37 27–35
Basalt 35–38 31–36
Fine-grained granite 31–35 29–31
Coarse-grained granite 31–35 31–33
Gneiss 26–29 23–26
Dolerite 36 32
Amphibolite 32
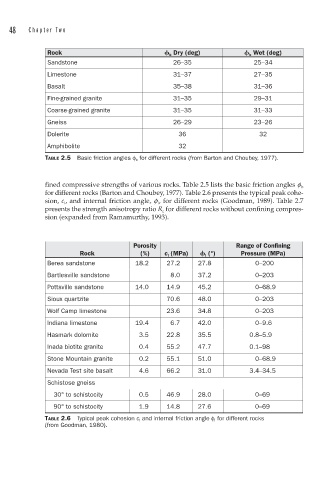
TABLE 2.5 Basic friction angles φ b for different rocks (from Barton and Choubey, 1977).
fined compressive strengths of various rocks. Table 2.5 lists the basic friction angles f b
for different rocks (Barton and Choubey, 1977). Table 2.6 presents the typical peak cohe-
sion, c i , and internal friction angle, f i , for different rocks (Goodman, 1989). Table 2.7
presents the strength anisotropy ratio R c for different rocks without confining compres-
sion (expanded from Ramamurthy, 1993).
Porosity Range of Confining
Rock (%) c i (MPa) i (°) Pressure (MPa)
Berea sandstone 18.2 27.2 27.8 0–200
Bartlesville sandstone 8.0 37.2 0–203
Pottsville sandstone 14.0 14.9 45.2 0–68.9
Sioux quartzite 70.6 48.0 0–203
Wolf Camp limestone 23.6 34.8 0–203
Indiana limestone 19.4 6.7 42.0 0–9.6
Hasmark dolomite 3.5 22.8 35.5 0.8–5.9
Inada biotite granite 0.4 55.2 47.7 0.1–98
Stone Mountain granite 0.2 55.1 51.0 0–68.9
Nevada Test site basalt 4.6 66.2 31.0 3.4–34.5
Schistose gneiss
30° to schistocity 0.5 46.9 28.0 0–69
90° to schistocity 1.9 14.8 27.6 0–69
TABLE 2.6 Typical peak cohesion c i and internal friction angle φ i for different rocks
(from Goodman, 1980).