
Page 57 - Mechatronics for Safety Security and Dependability in a New Era
P. 57
Ch09-I044963.fm Page 40 Tuesday, July 25, 2006 11:58 AM
Ch09-I044963.fm
40
40 Page40 Tuesday, July 25,2006 11:58 AM
We evaluated the changes of each element in the steady state with the following two values. The
self-propelled wheelchair propulsion is a cyclic movement to which a power balance can be applied
(Van der Woude et al (1998)) and Power output (P [W]) during wheelchair propulsion is equaled to
energy consumed of the body (Cooper (1998)). In this paper, we define the meaning of power ratio
as the ratio of propelling momentum to driving one at one cycle and power output for a given inertia
value is derived from each cyclic data average that is the measured propelling torque and the rear
wheel angular velocity:
> = co s) 0)
Relative exercise intensity was generally used to estimate physical strain for individualized program
by HR response and expressed as a percent of the heart rate reserve (1 [%]), determined by equation 2
(Janssenetal(1994)).
/ = (THR - RHR)I(MHR - RHR)x 100% (2)
The HR is measured during the test. HR takes steady response by the middle of the test. In this
research, The HR for about 1 minute before finishing the test is defined as THR [bpm], the HR at rest
is defined as RHR [bpm] when the subject gets up and MHR [bpm] is maximum HR, determined by
MHR = 220 - Age of a subject (3)
RESULTS
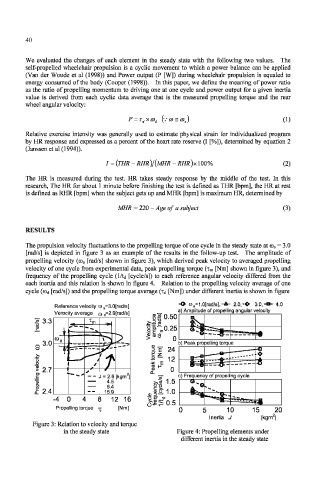
The propulsion velocity fluctuations to the propelling torque of one cycle in the steady state at <B S = 3.0
[rad/s] is depicted in figure 3 as an example of the results in the follow-up test. The amplitude of
propelling velocity (m a [rad/s] shown in figure 3), which derived peak velocity to averaged propelling
velocity of one cycle from experimental data, peak propelling torque (r m [Nm] shown in figure 3), and
frequency of the propelling cycle (1/td [cycle/s]) to each reference angular velocity differed from the
each inertia and this relation is shown in figure 4. Relation to the propelling velocity average of one
cycle (cod [rad/s]) and the propelling torque average (Td [Nm]) under different inertia is shown in figure
-
-O- co s=1.O[rad/s],-A- 2.0,-0- 3.0, B - 4.0
Reference velocity co s=3.0[rad/s]
^ a) Amplitude of propelling angular velocity
Veracity average co d=2.9[rad/s]
• S | 0.50
I" 3.3 £•.•2 co
8 ^ " 0.25
w H-^
ro a
3.0 b) Peak propelling torque
^ ' 24 __- — -a
/ _ -B— •
• 12
/ 't t
> 2.7
2
- - J =2.6[kgm ] ~ •$? c) Frequency of propelling cycle
4.5 >.]B 1.5
8.4
I 2.4 - - 15.9
-4 0 4 8 12 16 - ; • - -
Propelling torque ^ [Nm]
5 10 15 20
Inertia J [kgm*
Figure 3: Relation to velocity and torque
in the steady state Figure 4: Propelling elements under
different inertia in the steady state