
Page 66 - Media Effects Advances in Theory and Research
P. 66
Gamma –.08*** –.10** –.06* –.04 –.08** –.17** –.09** –.06 .03 –.03 .11* .02 –.25***
Conservative H 33 34 32 28 34 35 32 33 31 37 24 32 50
M 36 40 33 31 37 42 34 38 31 41 21 32 59
L 39 42 36 30 40 47 40 38 35 40 18 30 70
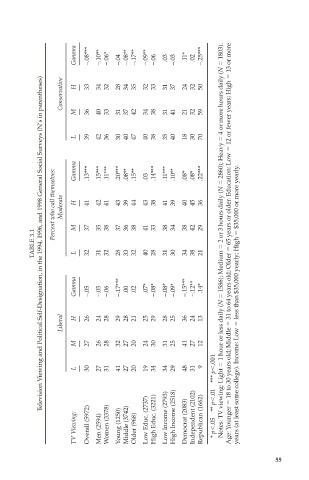
Percent who call themselves: Moderate Gamma H .13*** 41 .15*** 42 .11*** 41 .20*** 43 .08** 39 .15** 44 .03 43 .14*** 38 .11*** 41 .10** 39 .08* 40 .08* 45 .22*** 36 $35,000 or more yearly.
TABLE 3.1 Television Viewing and Political Self-Designation, in the 1994, 1996, and 1998 General Social Surveys (N’s in parentheses) M L 37 32 35 31 38 32 37 28 36 33 38 32 41 40 33 28 38 31 34 30 38 34 42 38 29 21 Notes: TV viewing: Light 1 hour or less daily (N 1586); Med
Gamma –.05 –.05 –.06 –.17*** .00 .02 .07* –.08* –.08* –.09* –.15*** –.12** .14*
Liberal H 26 24 28 29 28 21 25 29 28 25 36 24 13
M 27 26 28 32 27 20 24 30 31 25 41 27 12 years (at least some college). Income: Low less than $35,000 yearly; High
L 30 27 31 41 27 20 19 34 34 29 48 31 9 *** p .001
TV Viewing: Overall (5972) Men (2594) Women (3378) Young (1250) Middle (3742) Older (968) Low Educ. (2737) High Educ. (3221) Low Income (2793) High Income (2518) Democrat (2083) Independent (2102) Republican (1662) ** p .01 * p .05
55