
Page 166 - A Practical Guide from Design Planning to Manufacturing
P. 166
Microarchitecture 139
SPECfp2000 benchmarks measures performance on 14 floating-point
applications. 4
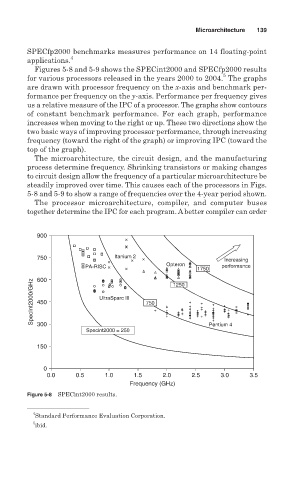
Figures 5-8 and 5-9 shows the SPECint2000 and SPECfp2000 results
5
for various processors released in the years 2000 to 2004. The graphs
are drawn with processor frequency on the x-axis and benchmark per-
formance per frequency on the y-axis. Performance per frequency gives
us a relative measure of the IPC of a processor. The graphs show contours
of constant benchmark performance. For each graph, performance
increases when moving to the right or up. These two directions show the
two basic ways of improving processor performance, through increasing
frequency (toward the right of the graph) or improving IPC (toward the
top of the graph).
The microarchitecture, the circuit design, and the manufacturing
process determine frequency. Shrinking transistors or making changes
to circuit design allow the frequency of a particular microarchitecture be
steadily improved over time. This causes each of the processors in Figs.
5-8 and 5-9 to show a range of frequencies over the 4-year period shown.
The processor microarchitecture, compiler, and computer buses
together determine the IPC for each program. Abetter compiler can order
900
750 Itanium 2 Increasing
PA-RISC Opteron performance
1750
600
SpecInt2000/GHz 450 UltraSparc III 750
1250
300
Specint2000 = 250 Pentium 4
150
0
0.0 0.5 1.0 1.5 2.0 2.5 3.0 3.5
Frequency (GHz)
Figure 5-8 SPECint2000 results.
4
Standard Performance Evaluation Corporation.
5
ibid.