
Page 249 - Microsoft Office Excel 2003 Programming Inside Out
P. 249
Formatting Excel Objects
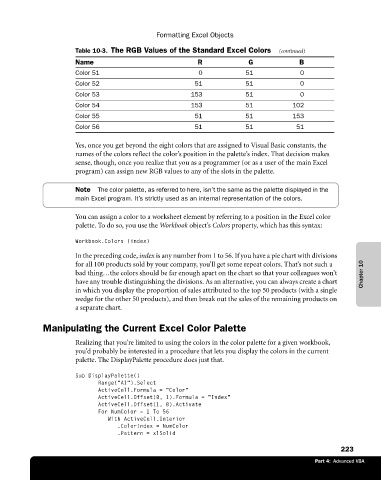
Table 10-3. The RGB Values of the Standard Excel Colors (continued)
Name R G B
Color 51 0 51 0
Color 52 51 51 0
Color 53 153 51 0
Color 54 153 51 102
Color 55 51 51 153
Color 56 51 51 51
Yes, once you get beyond the eight colors that are assigned to Visual Basic constants, the
names of the colors reflect the color’s position in the palette’s index. That decision makes
sense, though, once you realize that you as a programmer (or as a user of the main Excel
program) can assign new RGB values to any of the slots in the palette.
Note The color palette, as referred to here, isn’t the same as the palette displayed in the
main Excel program. It’s strictly used as an internal representation of the colors.
You can assign a color to a worksheet element by referring to a position in the Excel color
palette. To do so, you use the Workbook object’s Colors property, which has this syntax:
Workbook.Colors (index)
In the preceding code, index is any number from 1 to 56. If you have a pie chart with divisions
for all 100 products sold by your company, you’ll get some repeat colors. That’s not such a
bad thing…the colors should be far enough apart on the chart so that your colleagues won’t Chapter 10
have any trouble distinguishing the divisions. As an alternative, you can always create a chart
in which you display the proportion of sales attributed to the top 50 products (with a single
wedge for the other 50 products), and then break out the sales of the remaining products on
a separate chart.
Manipulating the Current Excel Color Palette
Realizing that you’re limited to using the colors in the color palette for a given workbook,
you’d probably be interested in a procedure that lets you display the colors in the current
palette. The DisplayPalette procedure does just that.
Sub DisplayPalette()
Range(“A1”).Select
ActiveCell.Formula = “Color"
ActiveCell.Offset(0, 1).Formula = “Index"
ActiveCell.Offset(1, 0).Activate
For NumColor = 1 To 56
With ActiveCell.Interior
.ColorIndex = NumColor
.Pattern = xlSolid
223
Part 4: Advanced VBA