
Page 30 - Microsoft Office Excel 2003 Programming Inside Out
P. 30
Part 1: Preliminaries
Microsoft Office Excel 2003 Programming Inside Out
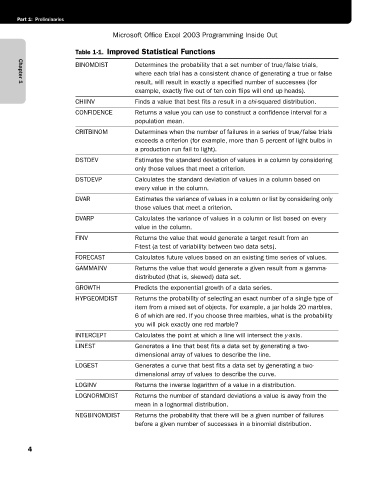
Table 1-1. Improved Statistical Functions
BINOMDIST Determines the probability that a set number of true/false trials,
where each trial has a consistent chance of generating a true or false
result, will result in exactly a specified number of successes (for
Chapter 1
example, exactly five out of ten coin flips will end up heads).
CHIINV Finds a value that best fits a result in a chi-squared distribution.
CONFIDENCE Returns a value you can use to construct a confidence interval for a
population mean.
CRITBINOM Determines when the number of failures in a series of true/false trials
exceeds a criterion (for example, more than 5 percent of light bulbs in
a production run fail to light).
DSTDEV Estimates the standard deviation of values in a column by considering
only those values that meet a criterion.
DSTDEVP Calculates the standard deviation of values in a column based on
every value in the column.
DVAR Estimates the variance of values in a column or list by considering only
those values that meet a criterion.
DVARP Calculates the variance of values in a column or list based on every
value in the column.
FINV Returns the value that would generate a target result from an
F-test (a test of variability between two data sets).
FORECAST Calculates future values based on an existing time series of values.
GAMMAINV Returns the value that would generate a given result from a gamma-
distributed (that is, skewed) data set.
GROWTH Predicts the exponential growth of a data series.
HYPGEOMDIST Returns the probability of selecting an exact number of a single type of
item from a mixed set of objects. For example, a jar holds 20 marbles,
6 of which are red. If you choose three marbles, what is the probability
you will pick exactly one red marble?
INTERCEPT Calculates the point at which a line will intersect the y-axis.
LINEST Generates a line that best fits a data set by generating a two-
dimensional array of values to describe the line.
LOGEST Generates a curve that best fits a data set by generating a two-
dimensional array of values to describe the curve.
LOGINV Returns the inverse logarithm of a value in a distribution.
LOGNORMDIST Returns the number of standard deviations a value is away from the
mean in a lognormal distribution.
NEGBINOMDIST Returns the probability that there will be a given number of failures
before a given number of successes in a binomial distribution.
4