
Page 348 - Microsoft Office Excel 2003 Programming Inside Out
P. 348
Part 5: Manipulating Excel Objects
Microsoft Office Excel 2003 Programming Inside Out
Before diving into Chart properties, methods and events, it’ll pay to review the individual
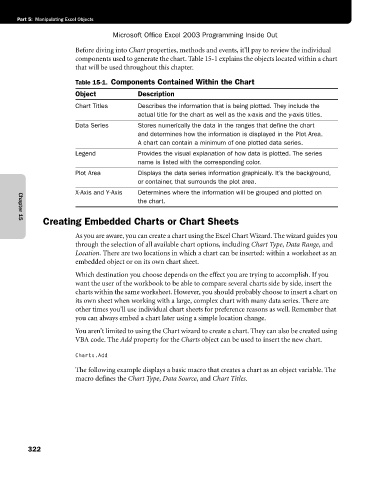
components used to generate the chart. Table 15-1 explains the objects located within a chart
that will be used throughout this chapter.
Table 15-1. Components Contained Within the Chart
Object Description
Chart Titles Describes the information that is being plotted. They include the
actual title for the chart as well as the x-axis and the y-axis titles.
Data Series Stores numerically the data in the ranges that define the chart
and determines how the information is displayed in the Plot Area.
A chart can contain a minimum of one plotted data series.
Legend Provides the visual explanation of how data is plotted. The series
name is listed with the corresponding color.
Plot Area Displays the data series information graphically. It’s the background,
or container, that surrounds the plot area.
X-Axis and Y-Axis Determines where the information will be grouped and plotted on
the chart.
Creating Embedded Charts or Chart Sheets
Chapter 15
As you are aware, you can create a chart using the Excel Chart Wizard. The wizard guides you
through the selection of all available chart options, including Chart Type, Data Range, and
Location. There are two locations in which a chart can be inserted: within a worksheet as an
embedded object or on its own chart sheet.
Which destination you choose depends on the effect you are trying to accomplish. If you
want the user of the workbook to be able to compare several charts side by side, insert the
charts within the same worksheet. However, you should probably choose to insert a chart on
its own sheet when working with a large, complex chart with many data series. There are
other times you’ll use individual chart sheets for preference reasons as well. Remember that
you can always embed a chart later using a simple location change.
You aren’t limited to using the Chart wizard to create a chart. They can also be created using
VBA code. The Add property for the Charts object can be used to insert the new chart.
Charts.Add
The following example displays a basic macro that creates a chart as an object variable. The
macro defines the Chart Type, Data Source, and Chart Titles.
322