
Page 350 - Microsoft Office Excel 2003 Programming Inside Out
P. 350
Part 5: Manipulating Excel Objects
Microsoft Office Excel 2003 Programming Inside Out
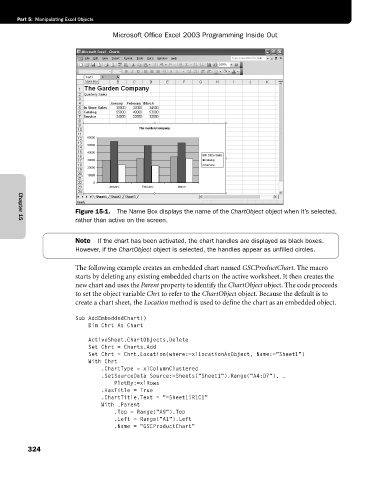
Figure 15-1. The Name Box displays the name of the ChartObject object when it’s selected,
rather than active on the screen.
Chapter 15
Note If the chart has been activated, the chart handles are displayed as black boxes.
However, if the ChartObject object is selected, the handles appear as unfilled circles.
The following example creates an embedded chart named GSCProductChart. The macro
starts by deleting any existing embedded charts on the active worksheet. It then creates the
new chart and uses the Parent property to identify the ChartObject object. The code proceeds
to set the object variable Chrt to refer to the ChartObject object. Because the default is to
create a chart sheet, the Location method is used to define the chart as an embedded object.
Sub AddEmbeddedChart()
Dim Chrt As Chart
ActiveSheet.ChartObjects.Delete
Set Chrt = Charts.Add
Set Chrt = Chrt.Location(where:=xlLocationAsObject, Name:="Sheet1”)
With Chrt
.ChartType = xlColumnClustered
.SetSourceData Source:=Sheets(“Sheet1”).Range(“A4:D7”), _
PlotBy:=xlRows
.HasTitle = True
.ChartTitle.Text = “=Sheet1!R1C1"
With .Parent
.Top = Range(“A9”).Top
.Left = Range(“A1”).Left
.Name = “GSCProductChart"
324