
Page 384 - Microsoft Office Excel 2003 Programming Inside Out
P. 384
Part 5: Manipulating Excel Objects
Microsoft Office Excel 2003 Programming Inside Out
Once the PivotCache object has been created, a PivotTable object can be created by using the
PivotCache object’s CreatePivotTable method. The CreatePivotTable method takes two argu
ments, the location of the upper-left corner of the PivotTable and the name of the PivotTable.
By default, the PivotTable is empty, so you need to define the row fields, the column fields,
and the data fields. Defining the rows and the columns involves using the PivotTable object’s
PivotFields collection and setting the Orientation property. The Position property is also set to
1, to allow you to add additional row and column fields.
Finally, the AddDataField method is used to define which fields are included in the data area
of the PivotTable. This routine takes three arguments, the PivotField object that should be
added to the data area, the title for the field, and the function used to combine the data fields
together.
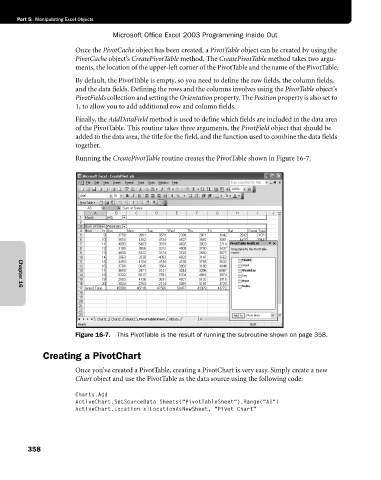
Running the CreatePivotTable routine creates the PivotTable shown in Figure 16-7.
Chapter 16
Figure 16-7. This PivotTable is the result of running the subroutine shown on page 358.
Creating a PivotChart
Once you’ve created a PivotTable, creating a PivotChart is very easy. Simply create a new
Chart object and use the PivotTable as the data source using the following code:
Charts.Add
ActiveChart.SetSourceData Sheets("PivotTableSheet").Range("A1")
ActiveChart.Location xlLocationAsNewSheet, "Pivot Chart"
358