
Page 385 - Microsoft Office Excel 2003 Programming Inside Out
P. 385
Part 5: Manipulating Excel Objects
PivotTables and PivotCharts
The Charts.Add method creates a new Chart object. Then SetSourceData method specifies the
PivotTable located on PivotTableSheet starting at cell A1. Finally, the Location method is used
to create a new sheet to hold the PivotChart and to give it the title Pivot Chart.
Manipulating PivotTables Programmatically
Pivoting a PivotTable by hand is a straightforward operation…you just drag the field header
to the desired location in the PivotTable layout. One common complaint from PivotTable
users, however, is that they often forget the exact configuration they need to emphasize a
certain point. When you have a relatively simple PivotTable, such as the six-field table used as
the example in this chapter, you probably won’t have too many difficulties remembering
what goes where. However, if your PivotTable has more than six fields, or if you’re working
with unfamiliar data, you might need to use some macro helpers to get you through your
presentation. This section contains four macros that you can use to build your own solutions.
Pivoting a PivotTable Programmatically
The first procedure shows you how to change the position of a field within a PivotTable. In
this case, you start with the PivotTable found on the PivotTable sheet of the EditPivot.xls
workbook, arranged in the layout shown in Figure 16-8.
Chapter 16
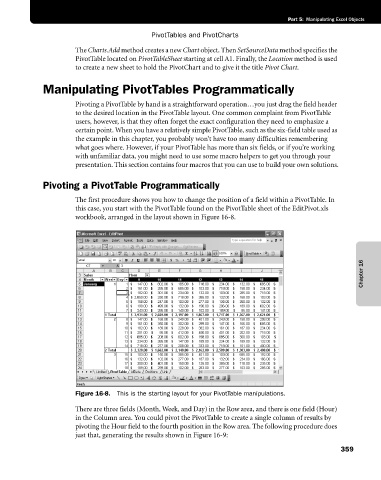
Figure 16-8. This is the starting layout for your PivotTable manipulations.
There are three fields (Month, Week, and Day) in the Row area, and there is one field (Hour)
in the Column area. You could pivot the PivotTable to create a single column of results by
pivoting the Hour field to the fourth position in the Row area. The following procedure does
just that, generating the results shown in Figure 16-9:
359