
Page 490 - Microsoft Office Excel 2003 Programming Inside Out
P. 490
Microsoft Office Excel 2003 Programming Inside Out
Chapter 21
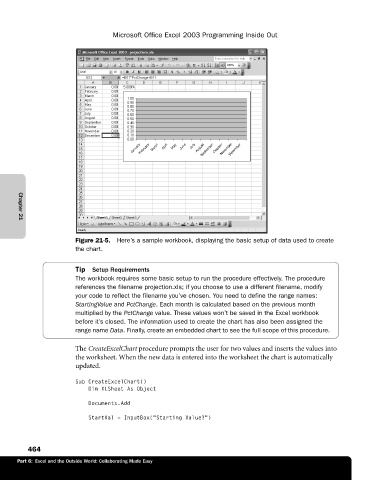
Figure 21-5. Here’s a sample workbook, displaying the basic setup of data used to create
the chart.
Tip Setup Requirements
The workbook requires some basic setup to run the procedure effectively. The procedure
references the filename projection.xls; if you choose to use a different filename, modify
your code to reflect the filename you’ve chosen. You need to define the range names:
StartingValue and PctChange. Each month is calculated based on the previous month
multiplied by the PctChange value. These values won’t be saved in the Excel workbook
before it’s closed. The information used to create the chart has also been assigned the
range name Data. Finally, create an embedded chart to see the full scope of this procedure.
The CreateExcelChart procedure prompts the user for two values and inserts the values into
the worksheet. When the new data is entered into the worksheet the chart is automatically
updated.
Sub CreateExcelChart()
Dim XLSheet As Object
Documents.Add
StartVal = InputBox("Starting Value?”)
464
Part 6: Excel and the Outside World: Collaborating Made Easy