
Page 76 - Microtectonics
P. 76
64 3 · Deformation Mechanisms
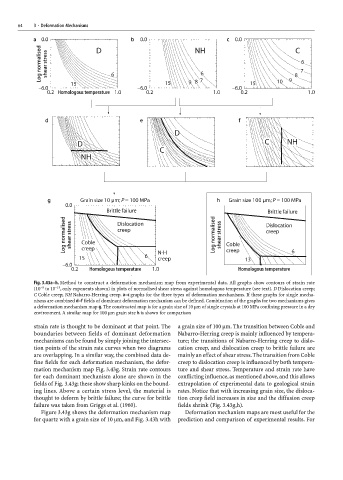
Fig. 3.43a–h. Method to construct a deformation mechanism map from experimental data. All graphs show contours of strain rate
–6
(10 to 10 –15 , only exponents shown) in plots of normalised shear stress against homologous temperature (see text). D Dislocation creep;
C Coble creep; NH Nabarro-Herring creep. a–c graphs for the three types of deformation mechanisms. If these graphs for single mecha-
nisms are combined d–f fields of dominant deformation mechanism can be defined. Combination of the graphs for two mechanisms gives
a deformation mechanism map g. The constructed map is for a grain size of 10 µm of single crystals at 100 MPa confining pressure in a dry
environment. A similar map for 100 µm grain size h is shown for comparison
strain rate is thought to be dominant at that point. The a grain size of 100 µm. The transition between Coble and
boundaries between fields of dominant deformation Nabarro-Herring creep is mainly influenced by tempera-
mechanisms can be found by simply joining the intersec- ture; the transitions of Nabarro-Herring creep to dislo-
tion points of the strain rate curves when two diagrams cation creep, and dislocation creep to brittle failure are
are overlapping. In a similar way, the combined data de- mainly an effect of shear stress. The transition from Coble
fine fields for each deformation mechanism, the defor- creep to dislocation creep is influenced by both tempera-
mation mechanism map Fig. 3.43g. Strain rate contours ture and shear stress. Temperature and strain rate have
for each dominant mechanism alone are shown in the conflicting influence, as mentioned above, and this allows
fields of Fig. 3.43g; these show sharp kinks on the bound- extrapolation of experimental data to geological strain
ing lines. Above a certain stress level, the material is rates. Notice that with increasing grain size, the disloca-
thought to deform by brittle failure; the curve for brittle tion creep field increases in size and the diffusion creep
failure was taken from Griggs et al. (1960). fields shrink (Fig. 3.43g,h).
Figure 3.43g shows the deformation mechanism map Deformation mechanism maps are most useful for the
for quartz with a grain size of 10 µm, and Fig. 3.43h with prediction and comparison of experimental results. For