
Page 78 - Microtectonics
P. 78
66 3 · Deformation Mechanisms
(Sibson 1983; Kohlstedt et al. 1995; Gleason and Tullis
1995). Such diagrams are valid for a specific mineral, grain
size, strain rate, geothermal gradient, orientation of brit-
tle faults and fluid pressure on faults. Differential stress
or strength of the material is plotted against depth. There
are two sets of intersecting curves. The straight curves
show strength of a brittle fault; with increasing depth, the
blocks on both sides of a fault are pressed together and
thereby increase the differential stress that is needed to
make the blocks move along the fault. The lower curves
are for dislocation creep and represent a decrease in
strength with increasing temperature at increasing depth.
High in the crust, brittle faulting is therefore favoured and
at deep levels dislocation creep. The crossover point is
known as the brittle-ductile transition. Notice that this is
not a simple surface in the crust; it lies at a different depth
for different minerals (Fig. 3.42) and depends on bulk
strain rate, fault orientation, geothermal gradient, grain
size and probably other factors. In practice, a wide transi-
tional zone where both mechanisms are active is usually
present. The depth-strength diagram has other disadvan-
tages; no deformation mechanisms other than just brittle
faulting and dislocation creep have been considered. Pres-
sure solution, for example, could considerably flatten the
stress peak at the brittle-ductile transition. If a rock de-
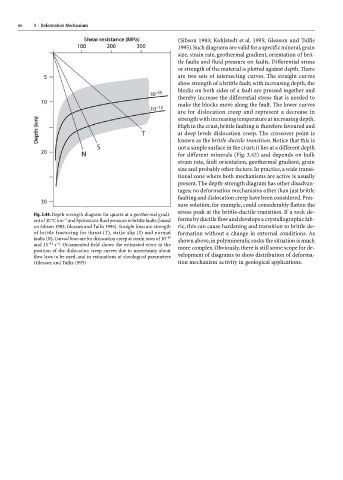
Fig. 3.44. Depth-strength diagram for quartz at a geothermal gradi-
–1
ent of 30 °C km and hydrostatic fluid pressure in brittle faults (based forms by ductile flow and develops a crystallographic fab-
on Sibson 1983; Gleason and Tullis 1995). Straight lines are strength ric, this can cause hardening and transition to brittle de-
of brittle fracturing for thrust (T), strike slip (S) and normal formation without a change in external conditions. As
faults (N). Curved lines are for dislocation creep at strain rates of 10 –15 shown above, in polymineralic rocks the situation is much
s . Ornamented field shows the estimated error in the
and 10 –12 –1
position of the dislocation creep curves due to uncertainty about more complex. Obviously, there is still some scope for de-
flow laws to be used, and in estimations of rheological parameters velopment of diagrams to show distribution of deforma-
(Gleason and Tullis 1995) tion mechanism activity in geological applications.