
Page 20 - Microtectonics
P. 20
6 1 · A Framework of Microtectonic Studies
1.3 1.3 temperature or decreasing pressure), many are based on
Deformation Phases and Metamorphic Events the passage of a single reaction line and therefore the di-
rection may vary by 180° (Fig. 1.6a). Although P-T-t paths
A metamorphic evolution can be subdivided into meta- are usually presented as a single smooth curve represent-
morphic events defined by the growth of particular meta- ing a single metamorphic cycle, possible complex details
morphic minerals, in a way similar to the concept of de- in the shape of the P-T-t path can rarely be resolved. Real
formation phases. Certain fabrics are indicative of growth P-T-t paths may have complex shapes with several minor
sequences in metamorphic rocks (e.g. inclusions in por- metamorphic cycles and subcycles which can only be re-
phyroblasts and reaction rims; Sects. 7.6.5, 7.8) and rela- constructed in rare cases, and then only through detailed
tions between porphyroblasts and foliations commonly combined structural and petrological studies (Fig. 1.6b;
reveal the relative time sequence of their generation Kriegsman 1993; Zhang et al. 1994).
(Sects. 7.3–7.5). However, one must keep in mind that a The P-T-t path will generally be valid for only a rela-
3
metamorphic event is of an essentially different nature tively small volume of rock (at most a few km ), and differ-
than a deformation phase. Whereas the latter is thought ent paths can often be reconstructed for different crustal
to reflect a period of deformation in between intervals of units. The way in which these differ gives important in-
little or no deformation, the former normally reflects only formation on the regional tectonic evolution. Where paths
the passing of critical P-T values necessary for a chemi- merge and continue together, rock volumes have been
cal reaction to start and to produce one or more new min- fixed with respect to each other (Figs. B.7.1 and B.7.2,
erals in the rock. Since deformation often has a catalys-
ing effect on mineral reactions, many such metamorphic
events are found to coincide approximately with defor-
mation phases. In other words, many metamorphic min-
erals are found to have grown during specific deforma-
tion phases.
The metamorphic history of a volume of rock can be
presented schematically in a P-T diagram as a curve, the
P-T-t path (pressure-temperature-time) (Fig. 1.6a; Daly et al.
1989). P-T-t paths as shown in Fig. 1.6 have been theoreti-
cally predicted (e.g. England and Richardson 1977; England
and Thompson 1984; Thompson and England 1984) and
have been reconstructed in tectonic studies from data points
that give P-T conditions at a certain time. Such data points
can be obtained from metamorphic events (reactions be-
tween minerals reconstructed from geometric relations in
thin section; Sect. 7.8) as compared with theoretically de-
termined petrogenetic grids. They can also be calculated
from the chemical composition of mineral pairs or asso-
ciations in equilibrium, the so-called geothermometers and
geobarometers (e.g. Spear and Selverstone 1983; Essene 1989;
Spear et al. 1990). For example, in Fig. 1.6a, the deforma-
tion phases are separated in time and the metamorphic
events related with them are interpreted as points on a
P-T-t path associated with a single metamorphic cycle (M )
1
with peak pressure attained during D and peak tempera-
1
ture during D . Data points are more common on the retro-
2
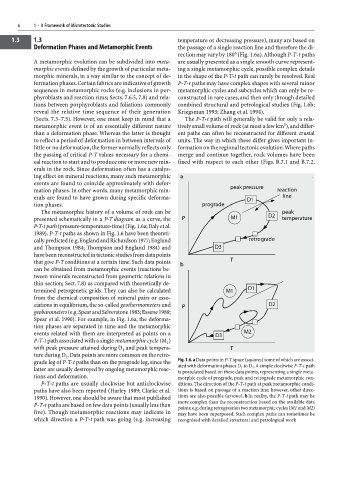
grade leg of P-T-t paths than on the prograde leg, since the Fig. 1.6. a Data points in P-T space (squares) some of which are associ-
ated with deformation phases D to D . A simple clockwise P-T-t path
latter are usually destroyed by ongoing metamorphic reac- 1 3
is postulated based on these data points, representing a single meta-
tions and deformation. morphic cycle of prograde, peak and retrograde metamorphic con-
P-T-t paths are usually clockwise but anticlockwise ditions. The direction of the P-T-t path at peak metamorphic condi-
paths have also been reported (Harley 1989; Clarke et al. tions is based on passage of a reaction line; however, other direc-
1990). However, one should be aware that most published tions are also possible (arrows). b In reality, the P-T-t path may be
more complex than the reconstruction based on the available data
P-T-t paths are based on few data points (usually less than
points; e.g. during retrogression two metamorphic cycles (M1 and M2)
five). Though metamorphic reactions may indicate in may have been superposed. Such complex paths can sometimes be
which direction a P-T-t path was going (e.g. increasing recognised with detailed structural and petrological work