
Page 66 - MODELING OF ASPHALT CONCRETE
P. 66
44 Cha pte r T w o
∗
FIGURE 2-13 Correlation between average rate of accumulation of strain (S) and G /sind.
It is believed that the initial permanent strain can be affected by many mixture
factors that are not related to the binders and this effect is carried to the total strain that
is commonly used in comparing mixtures. Based on this, the value of the logarithmic
slope (S) is selected as the more representative parameter that needs to be considered
for studying the role of the binders in permanent deformation of the mixtures.
Figure 2-13 shows the correlation between the average mixture rate of accumulated
∗
strain (S) and the parameter G /sind measured at 10 rad/s. As can be seen, there is
hardly any reasonable correlation. Correlations with mixture rutting of individual
aggregate blends showed similar lack of correlations. These results made it necessary to
explain the reason of this lack of correlations and search for a better indicator of binders’
contribution to mixtures’ rutting performance.
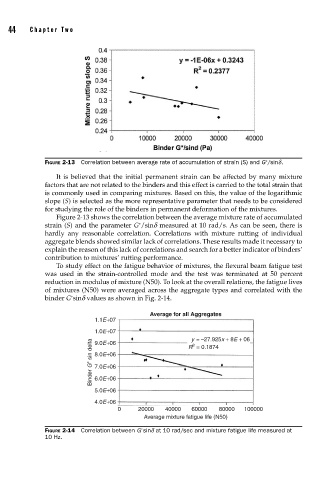
To study effect on the fatigue behavior of mixtures, the flexural beam fatigue test
was used in the strain-controlled mode and the test was terminated at 50 percent
reduction in modulus of mixture (N50). To look at the overall relations, the fatigue lives
of mixtures (N50) were averaged across the aggregate types and correlated with the
∗
binder G sind values as shown in Fig. 2-14.
Average for all Aggregates
1.1E+07
1.0E+07 y = −27.925x + 8E + 06
G ∗ sin delta 9.0E+06 R = 0.1874
2
8.0E+06
Binder 7.0E+06
6.0E+06
5.0E+06
4.0E+06
0 20000 40000 60000 80000 100000
Average mixture fatigue life (N50)
∗
FIGURE 2-14 Correlation between G sind at 10 rad/sec and mixture fatigue life measured at
10 Hz.