
Page 94 - MODELING OF ASPHALT CONCRETE
P. 94
72 Cha pte r T h ree
1.2
Computed Poisson’s ratio 0.8
1.0
0.6
0.4
0.4 0.6 0.8 1.0 1.2
Measured Poisson’s ratio
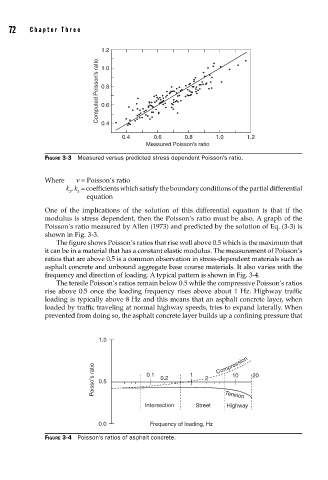
FIGURE 3-3 Measured versus predicted stress dependent Poisson’s ratio.
Where n = Poisson’s ratio
k , k = coefficients which satisfy the boundary conditions of the partial differential
2 3
equation
One of the implications of the solution of this differential equation is that if the
modulus is stress dependent, then the Poisson’s ratio must be also. A graph of the
Poisson’s ratio measured by Allen (1973) and predicted by the solution of Eq. (3-3) is
shown in Fig. 3-3.
The figure shows Poisson’s ratios that rise well above 0.5 which is the maximum that
it can be in a material that has a constant elastic modulus. The measurement of Poisson’s
ratios that are above 0.5 is a common observation in stress-dependent materials such as
asphalt concrete and unbound aggregate base course materials. It also varies with the
frequency and direction of loading. A typical pattern is shown in Fig. 3-4.
The tensile Poisson’s ratios remain below 0.5 while the compressive Poisson’s ratios
rise above 0.5 once the loading frequency rises above about 1 Hz. Highway traffic
loading is typically above 8 Hz and this means that an asphalt concrete layer, when
loaded by traffic traveling at normal highway speeds, tries to expand laterally. When
prevented from doing so, the asphalt concrete layer builds up a confining pressure that
1.0
Poisso’s ratio 0.5 0.1 0.2 1 2 Compression 20
10
Highway
Intersection Street Tension
0.0 Frequency of loading, Hz
FIGURE 3-4 Poisson’s ratios of asphalt concrete.